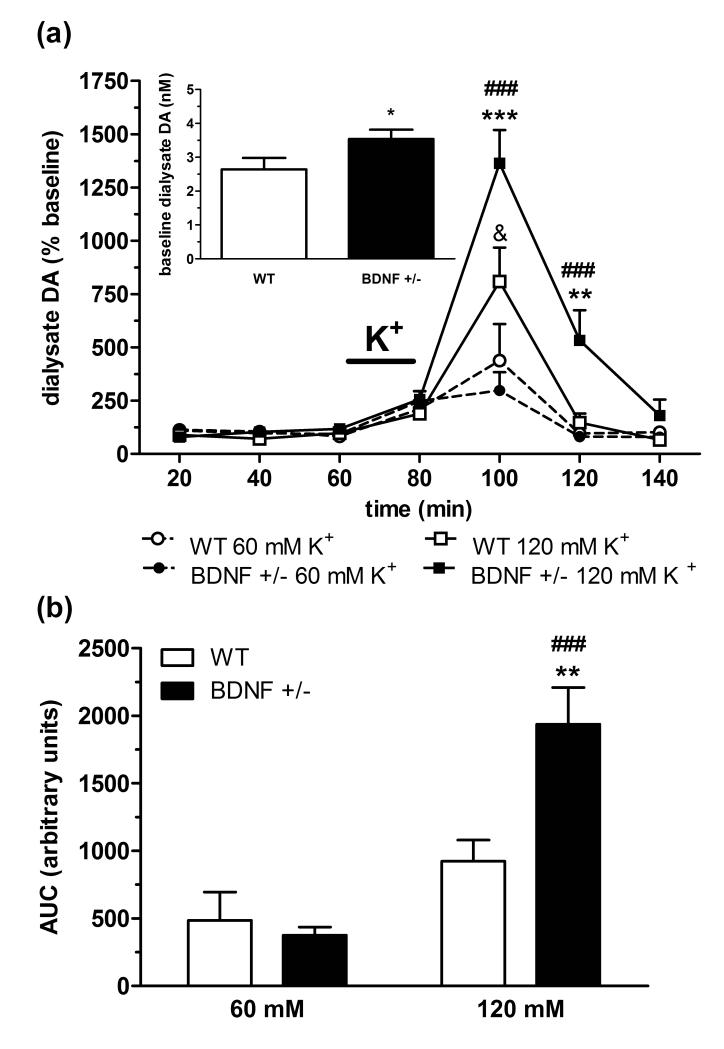
Figure 2.
Potassium-evoked dopamine (DA) response in the CPu of wildtype (WT) and BDNF+/− mice. (a) Time-course of extracellular dopamine elevations following 20 min perfusion of moderate (60 mM K+, dashed line) to high (120 mM K+, solid line) potassium aCSF. Data represent mean baseline-corrected dialysate dopamine levels ± SEM (n = 6/group). &p < 0.05, compared to WT 60 mM K+ group; ###p < 0.001, compared to BDNF+/− 60 mM K+ group; **p < 0.01, ***p < 0.001, compared to WT 120 mM K+ group (two-way ANOVA). Inset shows the combined baseline values (uncorrected for probe recovery, mean ± SEM) for WT and BDNF+/− mice from both K+ treatment groups. (b) Area under the curve (AUC) of the cumulative increase in extracellular DA over four 20 min samples (80 - 140 min) following K+ perfusion. Data are mean AUC ± SEM. ###p < 0.01 compared to BDNF+/− 60 mM K+ group; **p < 0.05 compared to WT 120 mM K+ group (Student’s t-test).

