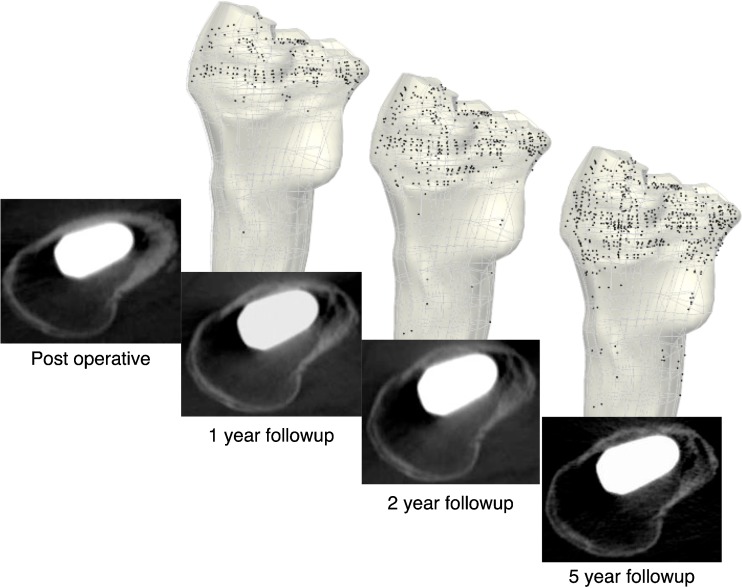
Fig. 5.
Increase in cortical bone porosity over the five-year period observed in one patient (71-year-old male). The black dots in the finite element (FE) models represent areas that transformed from cortical to porous cortical bone. These images show a pronounced porosity increase in the calcar and posterior metaphyseal regions, which is also shown in the patient’s CT scans. All patients showed similar increase in porosity

