Figure 7.

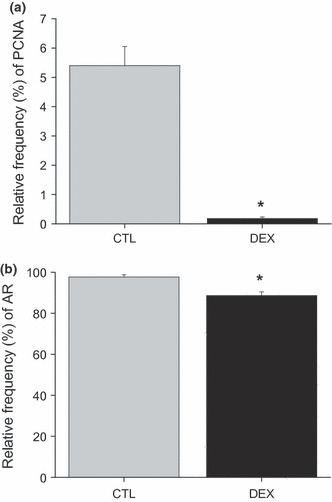
Relative frequency (%) of immunoreactions for PCNA-positive cells (a) and AR-positive cells (b). Data are reported as means ± SE. *P < 0.05 compared to control (Student’s t-test).

Relative frequency (%) of immunoreactions for PCNA-positive cells (a) and AR-positive cells (b). Data are reported as means ± SE. *P < 0.05 compared to control (Student’s t-test).