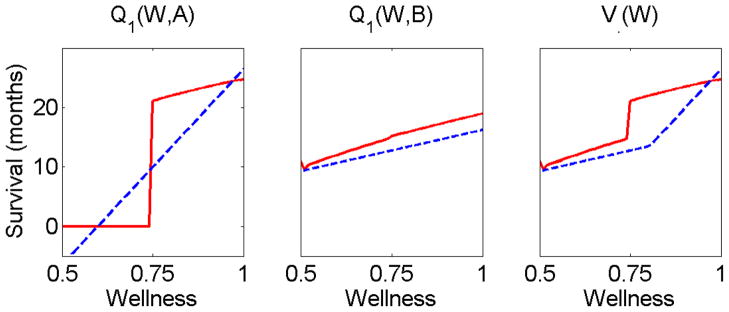
Fig 4.
The Q-functions computed by the proposed algorithm for a size 200 trajectory set. The left panel presents both the optimal Q-function (solid red curve) and the estimated Q-function (dashed blue curve) for different wellness levels and when treatment A is chosen. Similarly, the middle panel shows both Q-functions when treatment B is chosen. The right panel shows the optimal value function (solid red curve) and the estimated value function (dashed blue curve).

