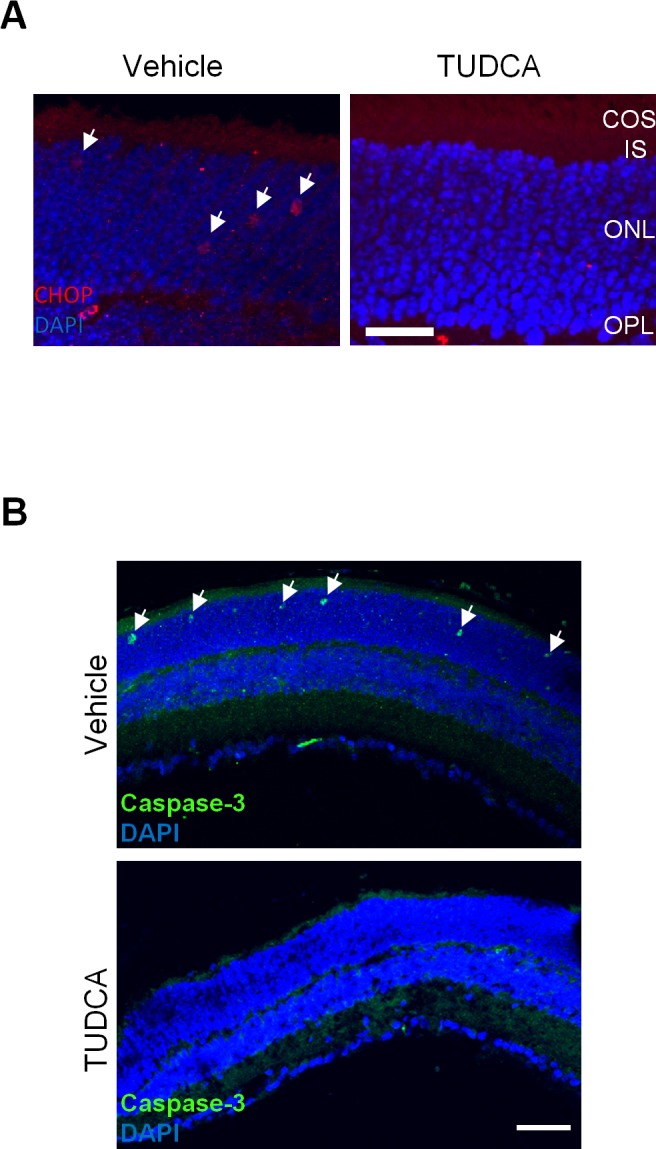
Figure 4. .

Effect of TUDCA treatment on CHOP and caspase-3 activation in Lrat–/– retina. (A) The ventral retinal sections of P18 Lrat–/– mice were labeled with an anti-CHOP antibody (red) and DAPI (blue). White arrows indicate CHOP signals in the ONL of the ventral retina of vehicle-injected Lrat–/– mice. Red signals in the OPL were due to the labeling of retinal vessels by the Cy3-conjugated goat anti-mouse secondary antibody. Scale bar = 20 μm. (B) Retinal sections of P18 Lrat−/− mice (vehicle or TUDCA injected) were labeled with an antibody against the active caspase-3 (green) and DAPI (blue). Arrows indicate caspase-3 signals in the ONL of the vehicle-injected mice. Scale bar = 50 μm.
