Figure 1. .
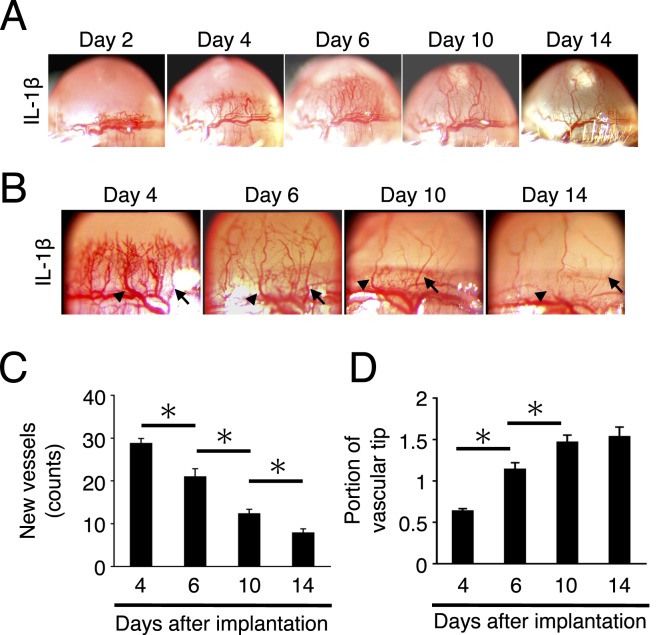
Time course of inflammatory angiogenesis. (A) Photomicrographs of corneas of BALB/c mice on days 2, 4, 6, 10, and 14 after IL-1β implantation. (B) Neovascularization in IL-1β–implanted corneas on days 4, 6, 10, and 14 at high magnification. Arrow and arrowhead indicate the same vessels at different time points. Between matured angiogenic vessels, most angiogenic vessels regressed. (C) Quantitation of the number of angiogenic vessels in IL-1β–implanted corneas on days 4, 6, 10, and 14 after implantation. (D) Quantitation of the portion of IL-1β–induced angiogenic tips on days 4, 6, 10, and 14 after implantation (n = 9–10). *P < 0.01.

