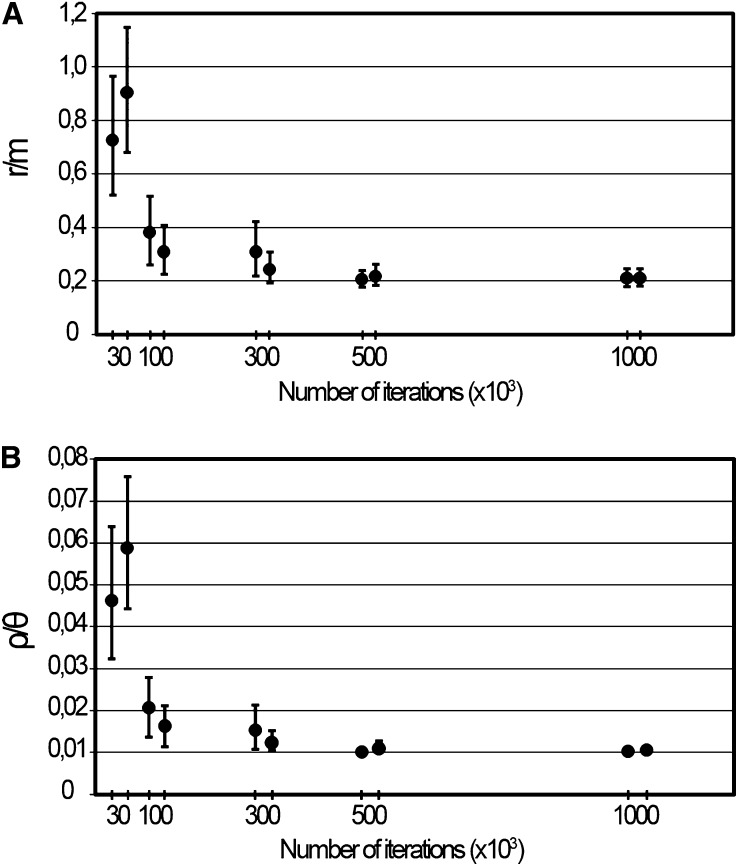
Figure 2 .
Accuracy assessment of r/m and ρ/θ estimations by varying the number of iterations. The figure illustrates the impact of the number of iterations on the estimations of the ratios r/m (A) and ρ/θ (B) inferred from the wide genomic data set. The graphs present the values and respective 95% confidence intervals of the two independent runs performed with the same number of iterations. The stability (graph plateau), reproducibility (the proximity of the mean estimates from replicate runs), and high levels of confidence (narrower error bars) of both r/m and ρ/θ values were reached only for runs using 500,000 and 1,000,000 iterations.

