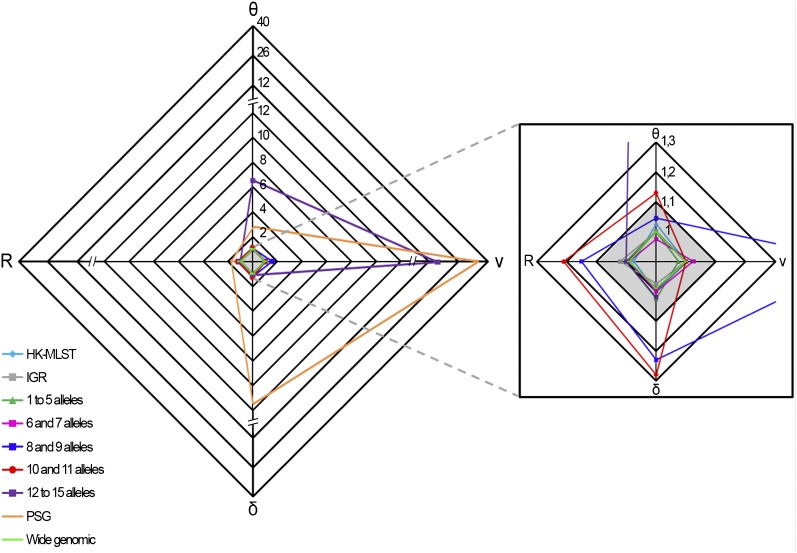
Figure 3 .
Convergence assessment of the parameters θ, ν, δ, and R. For each data set, the graph shows the convergence values from two independent simulations for the estimated parameters θ, ν, δ, and R. The shaded region of the graph (amplified on the right) indicates the satisfactory range of values (below 1.1) of the test statistic for all parameters according to the Gelman-Rubin test. For the data sets PSG (orange), “8 and 9 alleles” (dark blue), “10 and 11 alleles” (red), and “12 to 15 alleles” (purple), convergence was not observed for at least one parameter.

