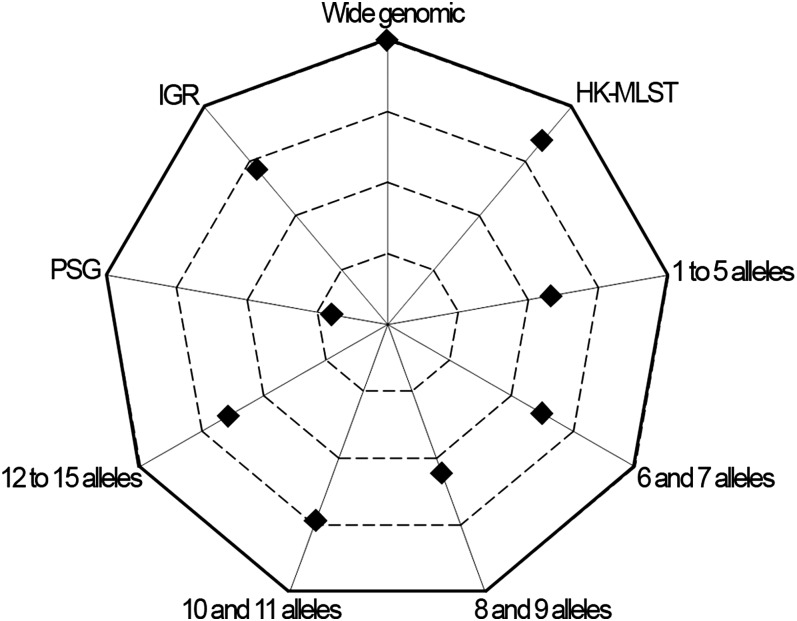
Figure 4 .
Concordance score between phylogenetic trees. The chart presents the average concordance scores between trees of replicate runs calculated for each data set. More external values correspond to higher concordance between trees, and the outer line represents the maximum average score (score = 3). Values were obtained by using the tree comparison tool of the ClonalFrame, which ranks each node of the first consensus tree according to the level of confidence found between the respective nodes of both trees from replicate runs. The color-based qualitative representation of this tool (see Figure S1) was converted into a quantitative approach as described in Materials and Methods to permit the concordance evaluation at the whole-tree level. Only the wide genomic data set reached the maximum average concordance score.

