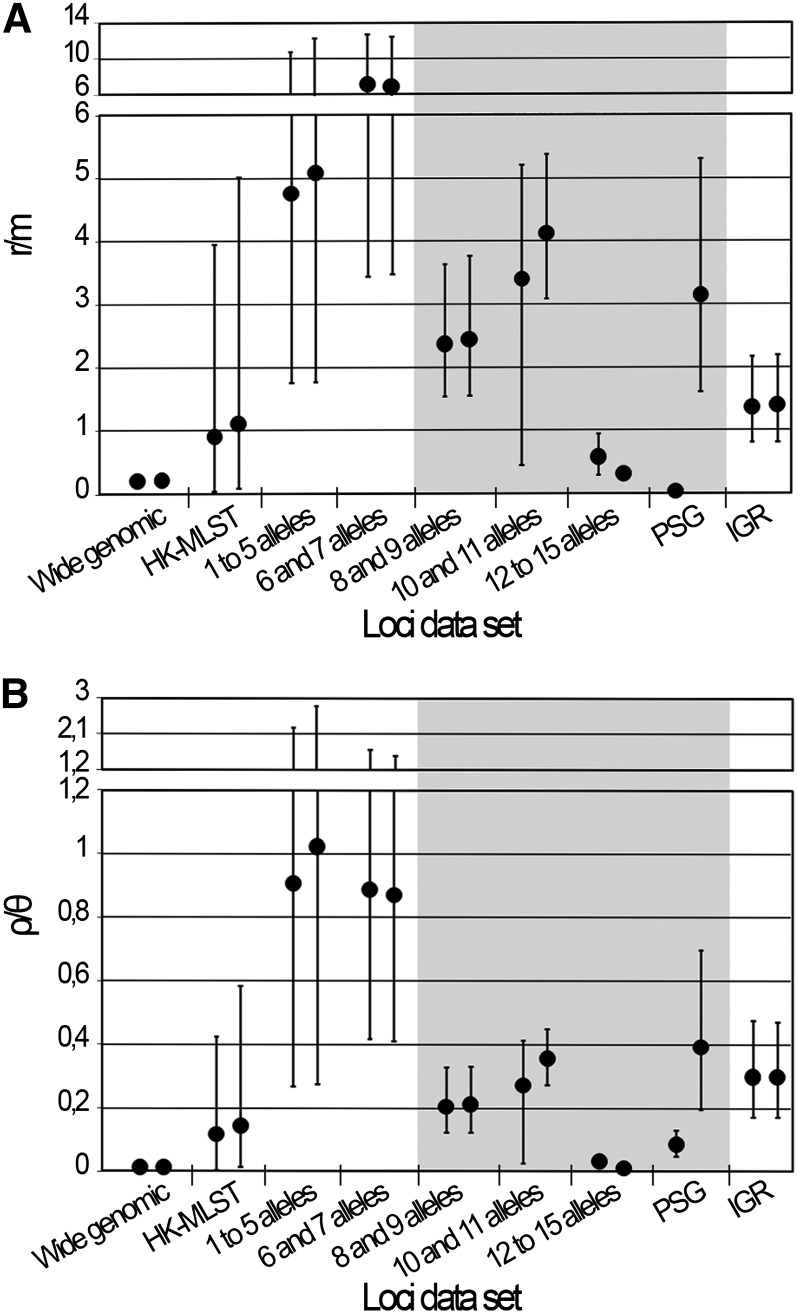
Figure 5 .
Estimates of r/m and ρ/θ. The graphs show the estimates of r/m (A) and ρ/θ (B) ratios calculated by the ClonalFrame software. For each data set, the results (mean and respective 95% CIs) of the two independent runs performed with 1,000,000 iterations are shown. The data sets that yielded nonconvergent runs assessed by the Gelman-Rubin test (see Figure 3) are shaded in gray.

