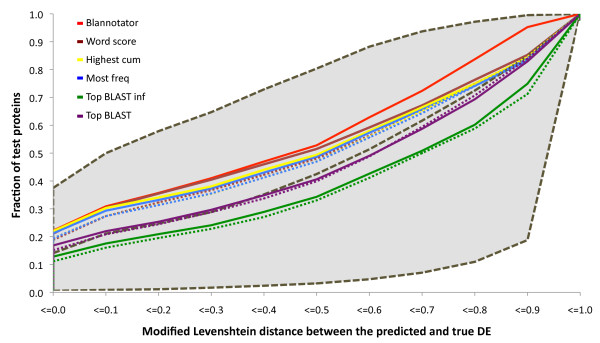
Figure 4.
The quality of automated protein function predictions. The fraction of predictions below a certain modified Levenshtein distance from the correct annotation is shown. Function prediction was performed from an unfiltered BLAST match list and a list from which circularly referenced annotations had been removed. Function prediction was based on the most significant BLAST match (purple), the top BLAST match without any uninformative words (green), the most common annotation among BLAST hits (blues), the annotation associated with the highest bit score sum (yellow), a word-based scoring scheme (brown) and BLANNOTATOR (red). Dashed lines show the performance of the tool when applied to the largest group of matches sharing a common GO annotation. The black dashed lines and the grey background indicates the theoretical level of performance when the ideal, median or worst-case predictions were chosen.

