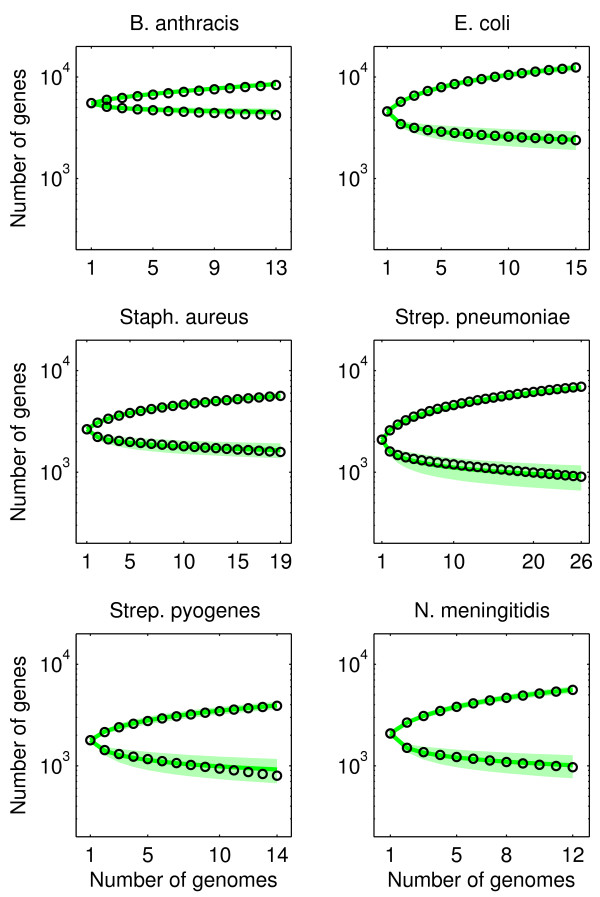
Figure 6.
Predictions for observed core and pan genome size for model D. We used the parameters λ1, θ1 and θ2 obtained from fitting the gene frequency distribution (see Figure 5) to evaluate the predicted core and pan genome size (see Additional file 1: Appendix S6). Black circles: data; green line: mean prediction; green shaded region: standard deviation of prediction. The increasing curves are for the pan genome; the decreasing curves are for the core genome.

