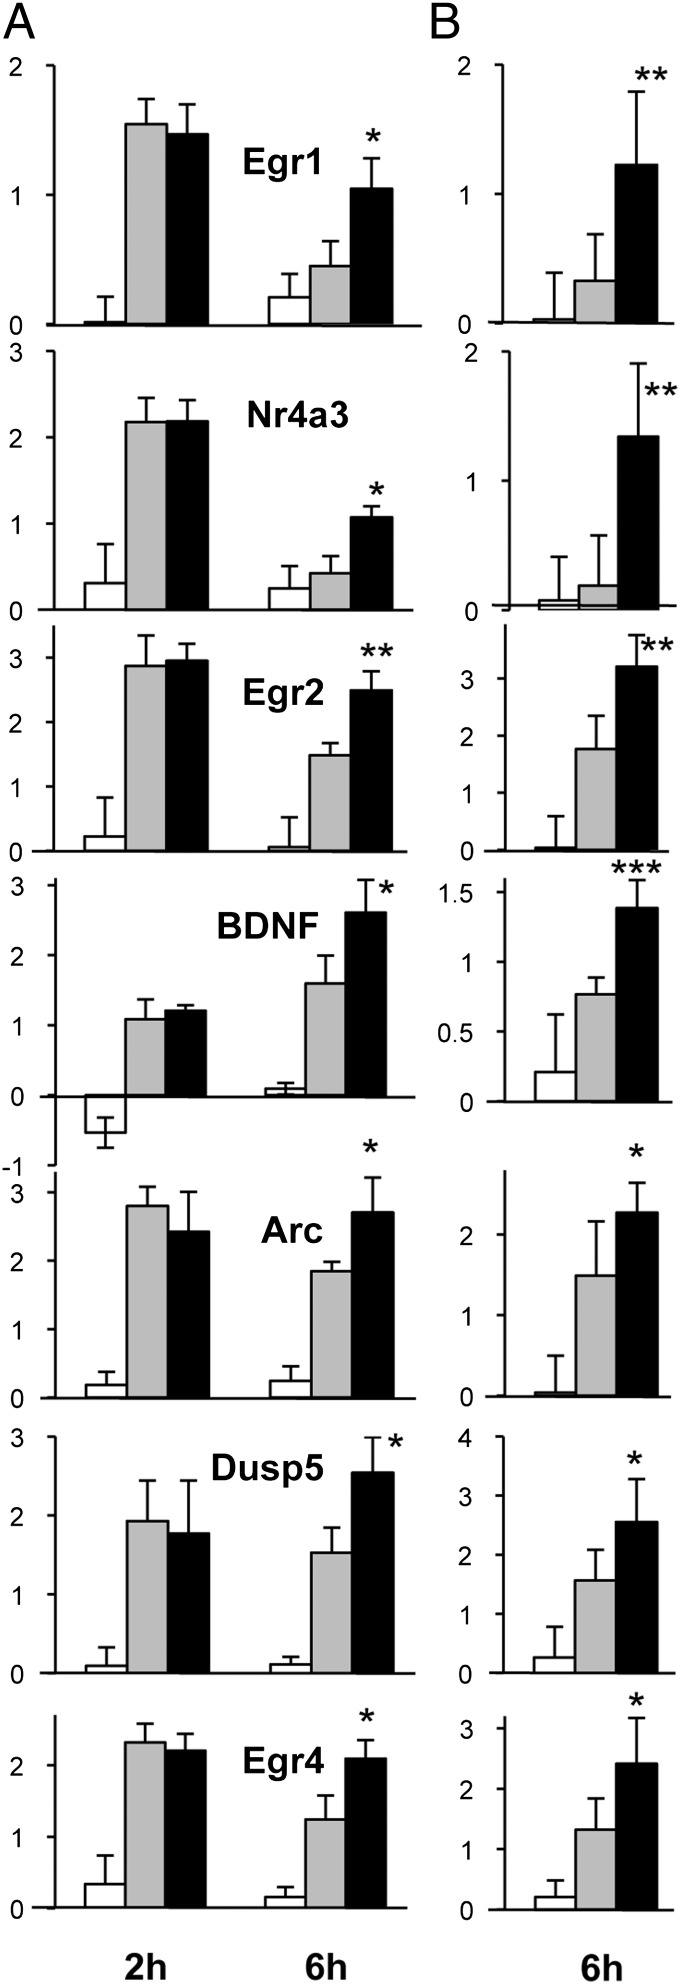
Fig. 2.
PCR validation of the microarray data. Results for seven genes are shown, comparing (A) expression data from microarrays at 2 h and 6 h (white bars represent sham surgery; gray bars represent ischemia; black bars represent ischemia+EPO) and (B) respective results from qPCR analysis at 6 h. Results are expressed as log base 2 ratio vs. one of the sham samples at 6 h. Microarray results are the average ± SD of triplicate samples (each sample was obtained by pooling two rat cortices). qPCR results are the average ± SD of six independent, nonpooled samples assayed in duplicate. ***P < 0.001; **P < 0.01; *P < 0.05 vs. ischemia by Student’s t test.

