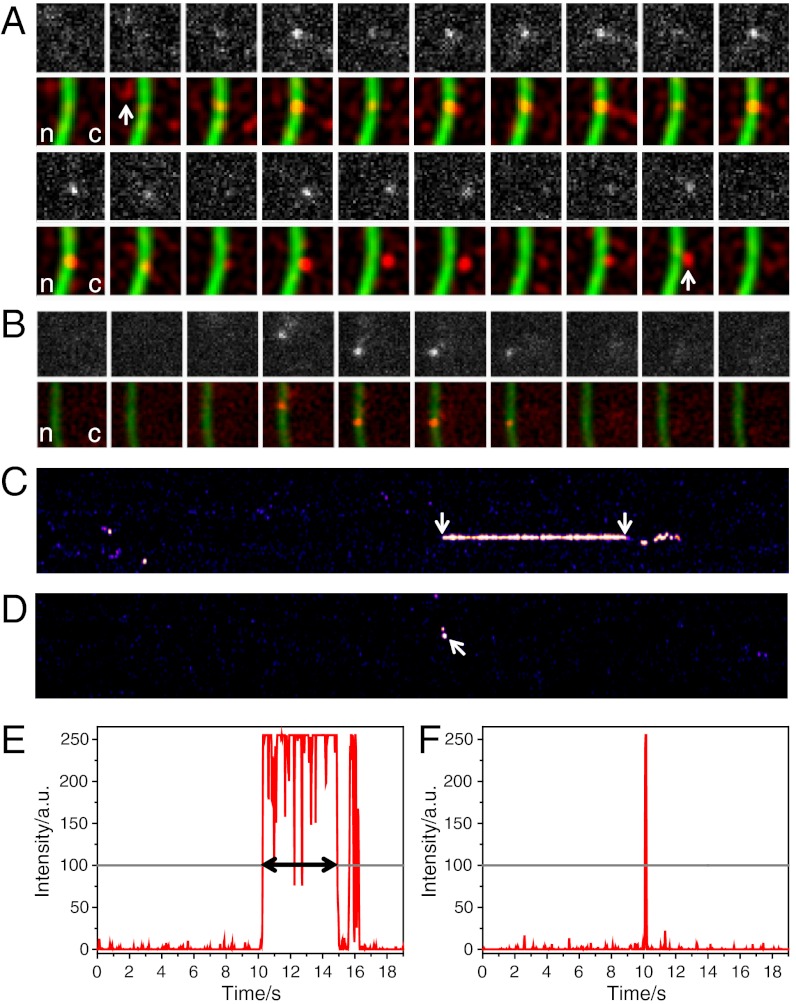
Fig. 3.
Binding time analysis of mRNPs and Dbp5 at the NE. (A) Time series showing a single hrp36-labeled mRNP during its export from nucleus (n) to cytoplasm (c). The 1st and 3rd rows show raw images of hrp36 fluorescence; the 2nd and 4th rows show filtered data (red) and the NTF2-stained NPCs (green). Because the mRNP was observed at the NE for 230 frames (4.6 s), only the first and last 10 frames were shown. The nuclear approach to and cytoplasmic departure from the NE were marked. Single image size, 4.5 μm2. (B) A single Dbp5 molecule binds to the NE. The upper row shows raw data, and the lower row the corresponding filtered frames (red) and the NTF2-stained NPCs (green). The Dbp5 molecule hit the NE at two different spots dwelling for 1 and 3 frames, respectively. Image size 5.25 μm2. (C) Kymograph of the mRNP export shown in (A). Hrp36-fluorescence along the NE was plotted vs. time (total 19 s). When the mRNP left the NPC at the cytoplasmic face the signal showed a characteristic wobbling (see Movie S1). Only the membrane-bound phase (arrows) was considered for dwell time determination. (D) Kymograph of the membrane binding of Dbp5 from (B) (arrow). Fluorescence intensity along one row of the respective kymographs: (E) mRNP export shown in (A), (C), and (F). Dbp5 binding shown in (B) and (D). Fluorescence intensity was plotted in red, and the threshold in gray. The dwell time was determined as the time until the signal intensity fell below the threshold for three subsequent frames.

