Fig. 5.
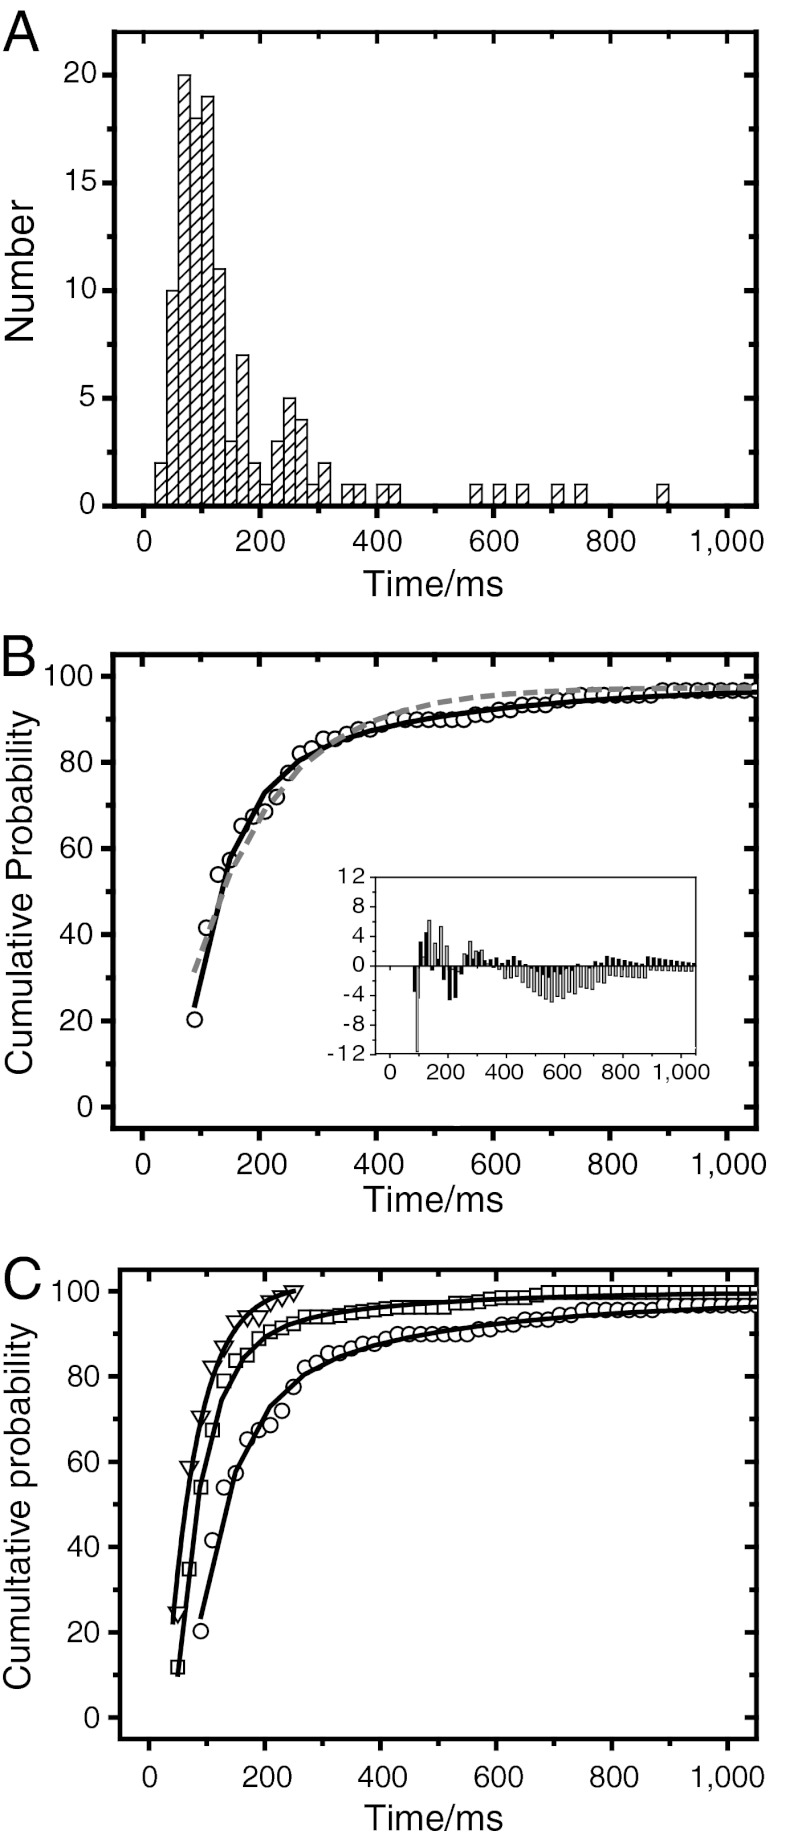
mRNP and Dbp5 kinetics binding to the NE. (A) Analysis of mRNP export kinetics. Membrane events that represented export events were collected and their duration plotted as histogram. (B) The normed cumulative counts of the histogram in (A) were determined and fitted by a mono- (dashed gray curve) and biexponential (solid black curve) function. The residuum plot (insert) demonstrated that the export data were better described by a biexponential (black columns) than a monoexponential function (gray columns). (C) Comparison of the kinetics of cytoplasmic probing of Dbp5 (triangles), nuclear probing (squares) and export (circles) of hrp36-labeled mRNPs. Solid curves indicate the mono- (nuclear/cytoplasmic probing) and biexponential (for export only) fits.

