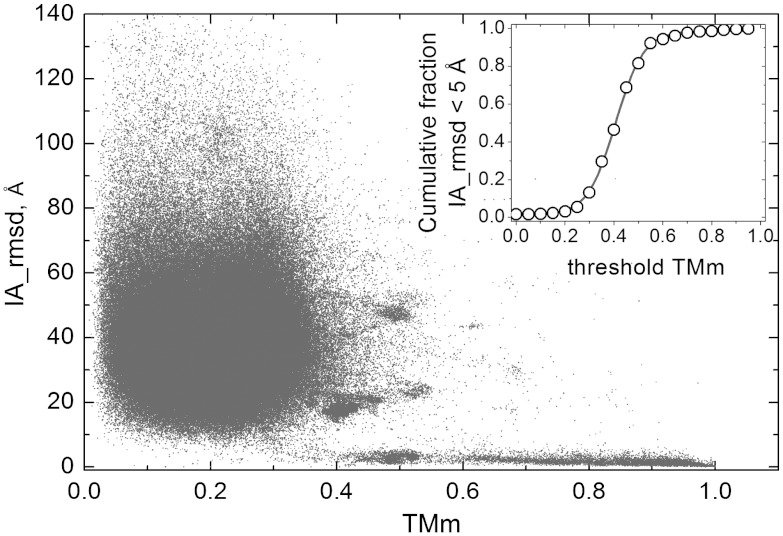
Fig. 1.
Correlation of the structural difference in binding modes with the structure alignment score. The interaction rmsd (IA) is plotted against the lowest of the two components protein TM-scores (TMm), in all-to-all pairwise comparison of 989 complexes extracted from Dockground at 95% sequence identity. In the inset, the cumulative fraction of the complex pairs with IA < 5 Å and TMm > threshold TMm is plotted as a function of threshold TMm to show the transition that occurs near the threshold TMm = 0.4.

