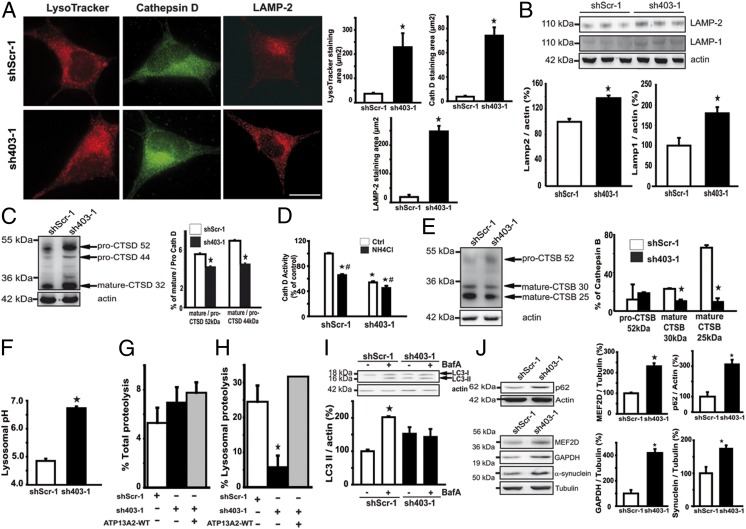
Fig. 3.
Characterization of ATP13A2-knockdown cell lines. (A) Accumulation of lysosomes and/or ALs in M17 cells with stable knockdown of ATP13A2 (sh403-1) under basal conditions, as evidenced by LysoTracker staining and immunohistochemistry for cath-D and LAMP-2. (Scale bars, 10 μm.) (B and C) Representative immunoblot levels of LAMP-2, LAMP-1, and cath-D in sh403-1 and control (Ctrl) cells (shScr-1). (D) In vitro assay of cath-D enzyme activity in lysosomal fractions of sh403-1 and shScr-1 cells. (E) Cath-B (CTSB) immunoblot levels in sh403-1 and shScr-1 cells. (F) Lysosomal pH values in sh403-1 and shScr-1 cell lines. (G and H) Degradation of long-lived proteins in shScr-1 and sh403-1 cells and in lentiviral (LV)-transduced sh403-1 cells. (H) Lysosomal degradation (i.e., sensitive to NH4Cl/leupeptin) in shScr-1 and sh403-1 cells and LV-transduced sh403-1 cells. (I) LC3 immunoblot levels in M17 cells treated or not treated with 5 nM bafilomycin A1 for 1 h. (J) Immunoblot levels of p62, MEF2D, GAPDH, and α-synuclein in control and ATP13A2-knockdown cells. In all panels, n = 3–5 per experimental group. *P < 0.05 compared with shScr-1.

