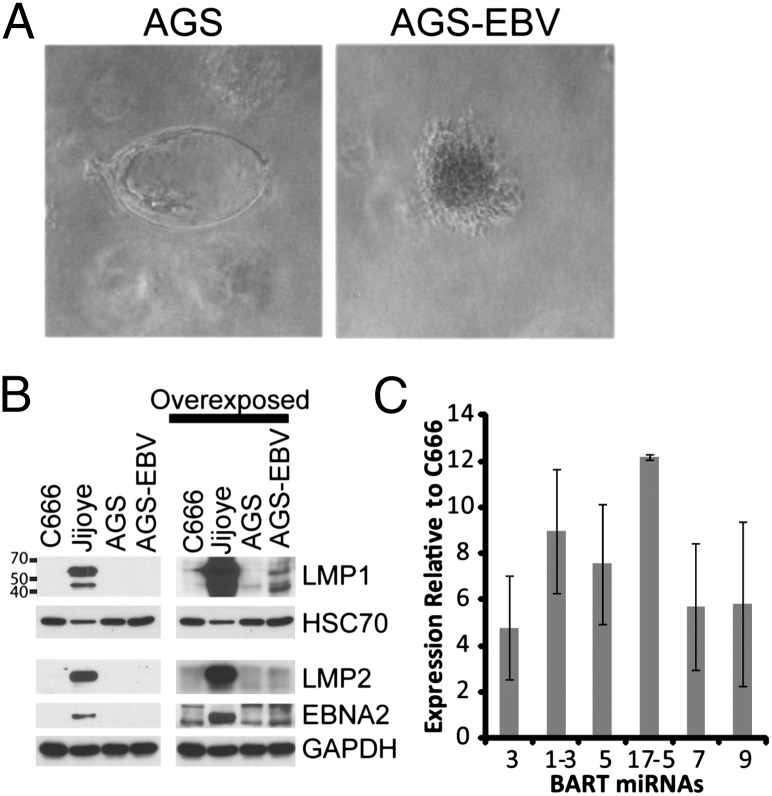
Fig. 1.
Phenotype and expression pattern of AGS cells infected with EBV. (A) AGS cells and AGS cells infected with EBV were grown in soft agar for 12 d. A representative colony from the infected cells compared with a picture of the aborted colonies from the uninfected cells is shown. The pictures as currently shown are at 100× magnification. (B) Expression of EBV latent proteins in AGS cells; AGS cells infected with EBV; Jijoye, a type III BL cell line; and C666-1, an NPC cell line. Expression of LMP1, LMP2, and EBNA2 by Western blotting is shown, with HSC70 and GAPDH used as loading controls (Left) or overexposed to show the small amount of LMP1 (Right) expressed in the AGS-EBV cells. (C) Quantitative RT-PCR for representative BART miRNAs in AGS-EBV cells. Plotted are the relative expression levels of each miRNA relative to the NPC cell line C666-1 from three independent experiments with the SEM indicated.

