
Fig. 4.
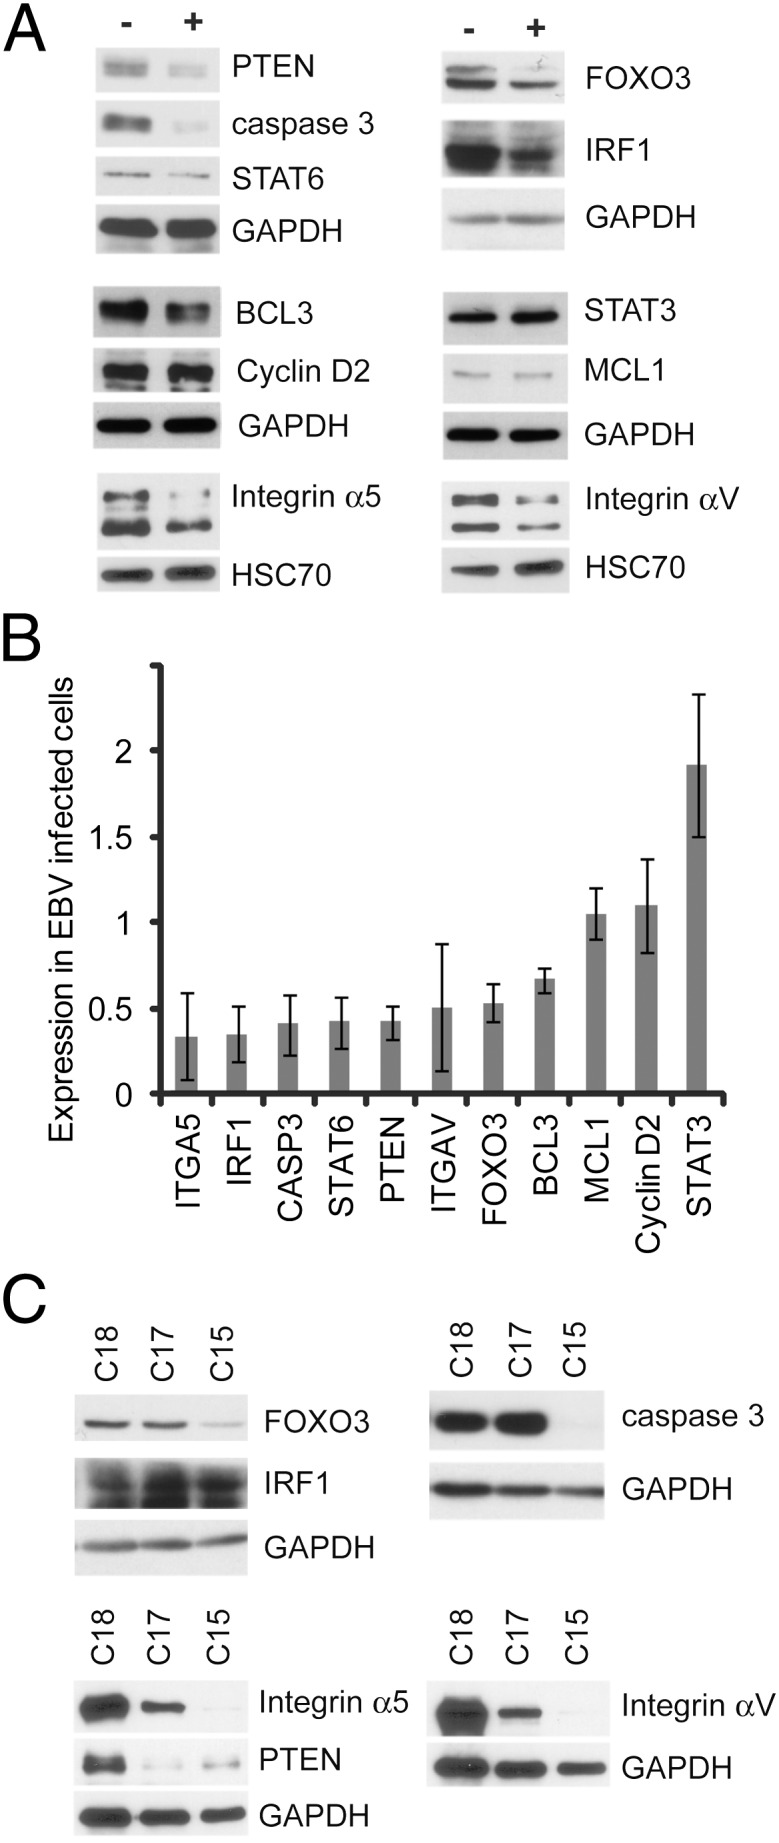
Analysis of select genes shown to be down-regulated by microarray. (A) Western blot analysis of a group of genes down-regulated by microarray and predicted to be BART miRNA targets. Expression in AGS cells infected with EBV (+) is compared with that in noninfected AGS cells (−). GAPDH and HSC70 serve as loading controls. (B) Densitometry quantification of immunoblots for the indicated proteins. The ratio of the signal in infected cells vs. uninfected cells normalized to the loading control and averaged between at least three independent experiments is indicated with error bars representing the SEM. (C) Expression of the down-regulated proteins in protein lysates prepared from the NPC xenografts C15 (BART miRNA-positive) and C17 and C18 (BART miRNA-negative). GAPDH serves as the loading control.