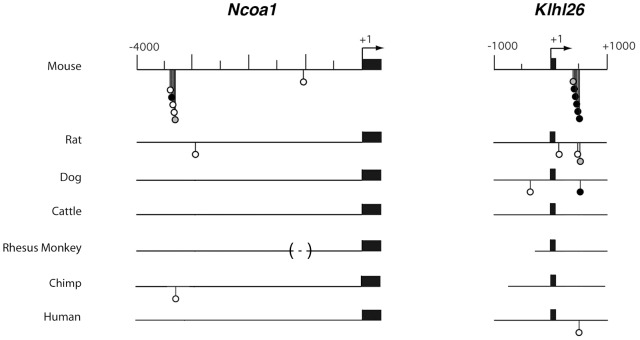
Figure 6. Comparative Consite analyses of Ncoa1 and Klhl26 sequences from 7 mammalian species.
The 4 kb of DNA sequences upstream of the Ncoa1 transcription start site (left), or the 2 kb surrounding the Klhl26 transcription start site (right), were analyzed in 7 mammalian species using Consite as before. Results are represented as in Figure 1D. Shorter lines, or dashed lines within brackets, indicate incomplete sequences.

