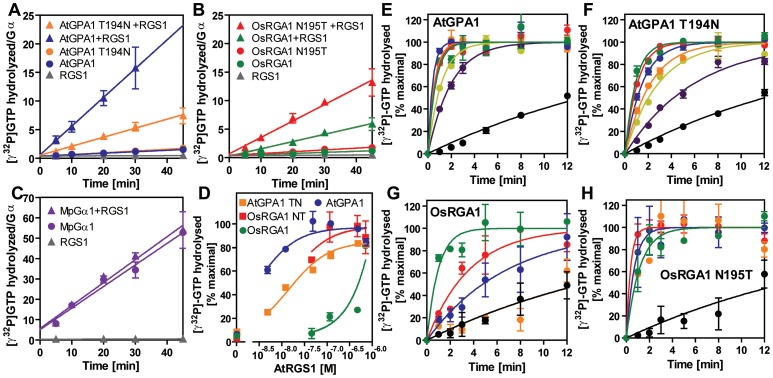
Figure 7. GAP activity of RGS toward plant Gα subunits.
(A–C) Time course of steady-state [γ32P]GTP hydrolysis by 500 nM Gα in the presence or absence of 750 nM AtRGS1 were measured over time after incubation at 20°C. Rate of Pi production (mol/mol Gα protein) were shown. Data are mean ± SEM of duplicate samples. (D–H) Single turnover [γ32P]GTP hydrolysis by 500 nM Gα proteins with AtRGS1 (0 nM (black), 5 nM (purple), 12.5 nM (yellow), 50 nM (orange), 125 nM (blue), 500 nM (red) and 750 nM (green)). Data are mean +/− SEM for more than two individual experiments, except OsRGA1 with 50 nM RGS at 1 min and 5 min. Dose dependency of single time point (2 min) was shown in (D).

