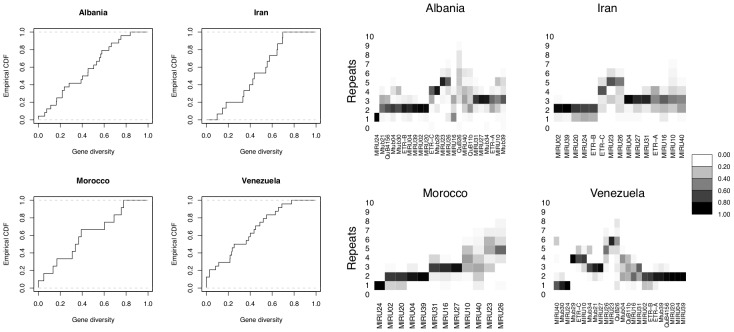
Figure 2. Genetic diversity of VNTR loci for each published dataset.
Left plots: Empirical cumulative distribution function of gene diversity across loci. The gene diversity is computed at each locus as  where
where  is the number of isolates with repeat size
  at locus
  . Right plots: Heat-map diversity, following Aminian et al (2009), illustrating the proportion of tandem repeats for each locus (ordered according to the original study).

