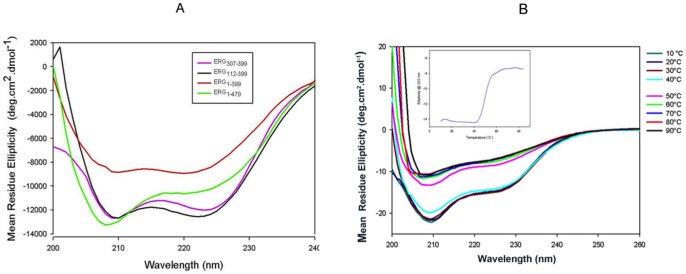
Figure 5. CD spectra of Ergp55 polypeptides.
(A) CD spectra of Erg1–479, Erg1–399, Erg112–399 and Erg307–399 polypeptides recorded from 200 nm to 260 nm. (B) Temperature induced unfolding of full length Ergp55 protein. The plot (inner) containing mean residue ellipticity versus temperature indicates the denaturation of α-helices of folded full length Ergp55.

