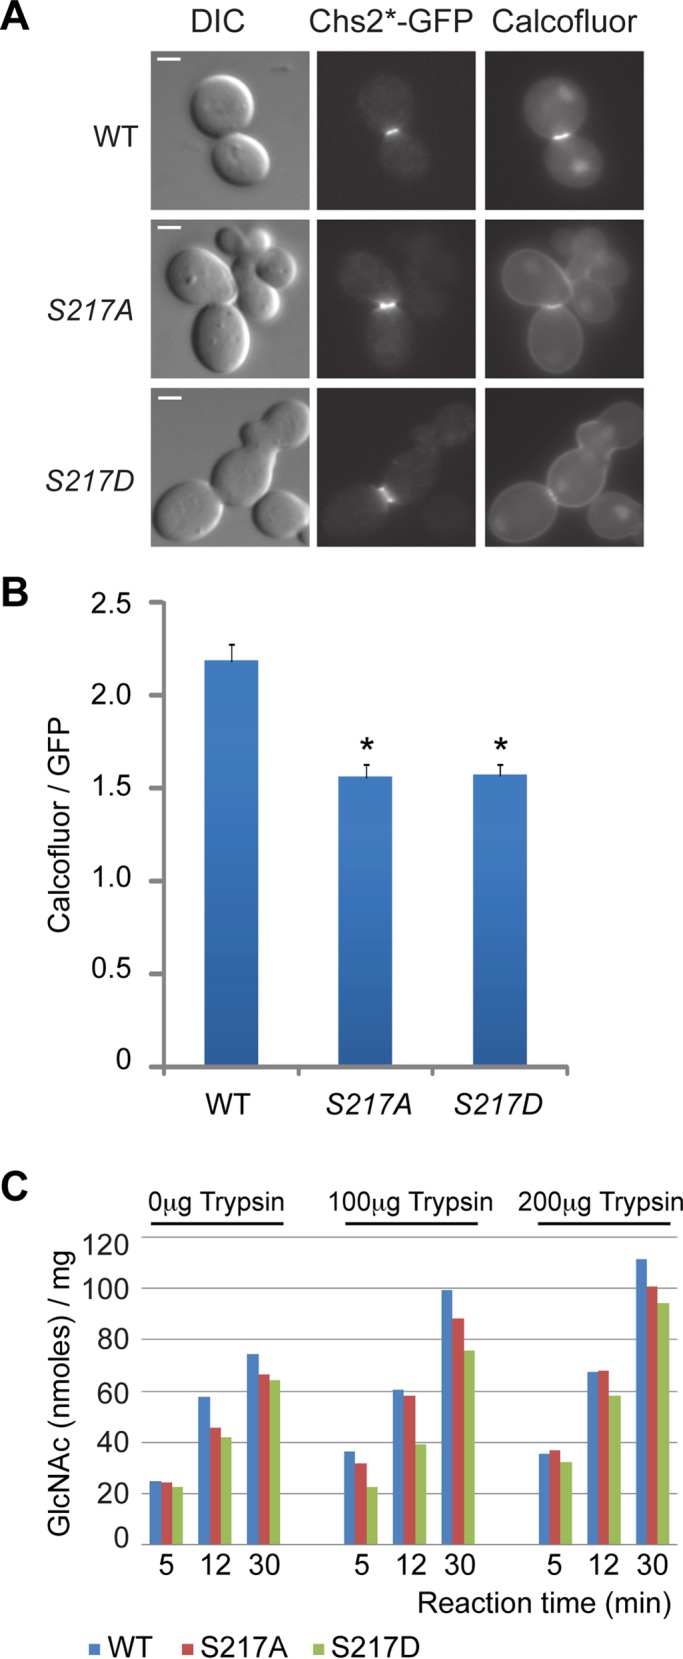
FIGURE 3:

Phosphorylation and dephosphorylation of Ser-217 affect chitin synthesis at the division site. (A) Cells (YO1320, YO1324, and YO1325; chs1∆ chs2∆ chs3∆ with YCp111-Chs2*-GFP plasmids) were grown in SC-LEU medium to exponential phase at 25°C and then diluted into rich media (YM-1) and grown for additional 3 h at 25°C. Chs2*‑GFP and cellular chitin (stained with 10 mg/ml Calcofluor) were visualized by fluorescence microscopy. (B) Quantification of chitin synthesis in vivo. The ratio of Calcofluor staining intensity divided by Chs2*-GFP signal intensity was plotted for each indicated strain (WT, n = 21; S217A, n = 21; S217D, n = 26). The error bar represents SEM. *p < 0.001 in comparison to WT. (C) Cells (YO1535, YO1536, and YO1537; chs1∆ chs3∆ with YEp-pGAL1-HA3-Chs2* plasmid [2 μ, TRP1]) were grown in inducing medium (yeast nitrogen base containing 2% galactose and 1% raffinose) for 18 h at 25°C. In vitro chitin synthase II activity was measured with and without prior treatment of portions of membranes with 0, 100, and 200 μg of trypsin. Scale bar, 2 μm.
