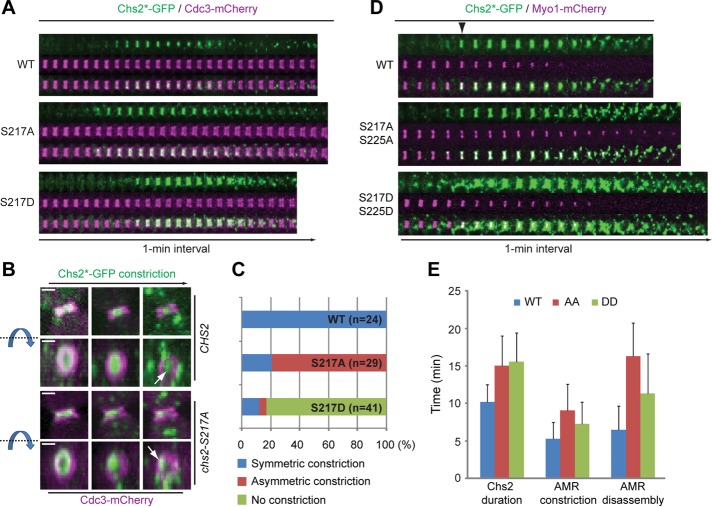
FIGURE 4:
Chs2-S217A and Chs2-S217D display distinct dynamic behaviors during cytokinesis. (A) Localization patterns of Chs2-S217A and Chs2-S217D during the cell cycle. Cells of different strains (YO1339, YO1359, and YO1360; chs2∆ CDC3-mCherry with integrated Chs2*-GFP in at the leu2 locus) were grown in SC-LEU medium to exponential phase at 25°C and then diluted into rich media (YM-1) and grown for additional 1–2 h at 25°C before being subjected to time‑lapse analysis. (B) Three‑dimensional reconstruction of selected time points for the cells shown in A. Both the side view (top) and the en face view (bottom) of the cells are presented. The blue arrow and dashed line indicate the direction of rotation. White arrow indicates the position of Chs2*‑GFP near the end of its constriction. Scale bar, 1 μm. (C) Data acquired in A were quantified for the constriction patterns of Chs2-S217A and Chs2-S217D (WT, n = 22; S217A, n = 29; S217D, n = 41). (D) Spatial relationship between Chs2-S217A or Chs2-S217D and the actomyosin ring during cytokinesis. Cells of different strains (YO1454, YO1453, and YO1455; chs2∆ Chs2*-GFP::LEU2 with pRS314‑MYO1-C-mCherry) were cultured and imaged as in A. Arrowhead indicates the onset of AMR constriction. (E) Quantification of the durations of Chs2*-GFP, AMR contraction, and AMR disassembly during cytokinesis (WT, n = 16; S217A S225A, n = 17; S217D S225D, n = 29).

