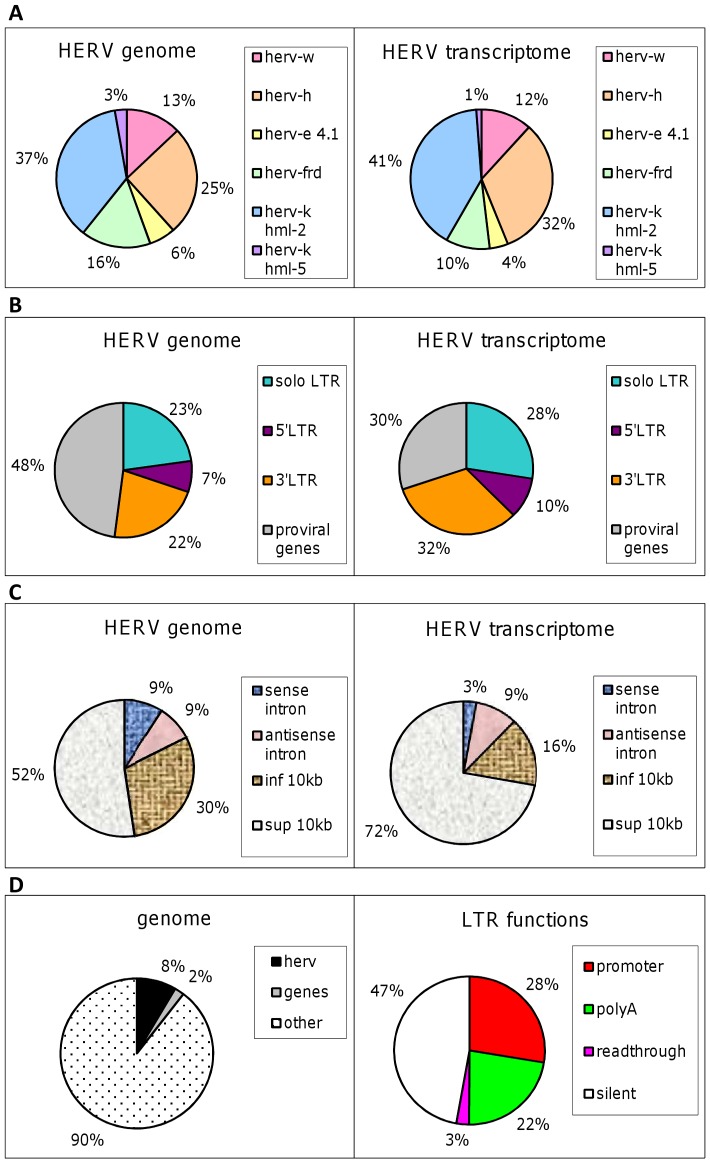
Figure 5. Genomic and transcriptomic projections of the HERV repertoire.
(A) HERV families. The 6 HERV families studied in this work are voluntarily depicted as 100% of HERV human genome, in the proportions described in Table 1a . The transcriptome picture is obtained from results detailed in Table 1c after applying a correction factor that takes into consideration chip content in Table 1b . (B) HERV structures. Solo LTR and proviruses account for 100% of the HERV genome in the proportion described in Table 1a . The transcriptome part is based on Table 1c after correction taking into consideration the chip content presented in Table 1b . (C) HERV environment. A systematic search for genomic environment is performed for elements present in the HERV database (genome) and the active elements described in Table 1c (transcriptome). The proportion of the 3 types of LTR is based on Table 1a and the transcriptome from Table 1c after correction using Table 1b . (D) The role of junk DNA. HERV sequences represent approximately 8% of the human genome. The graph of LTR functions is based on Figure 3B after a correction based on the number of attributable functions and chip content.

