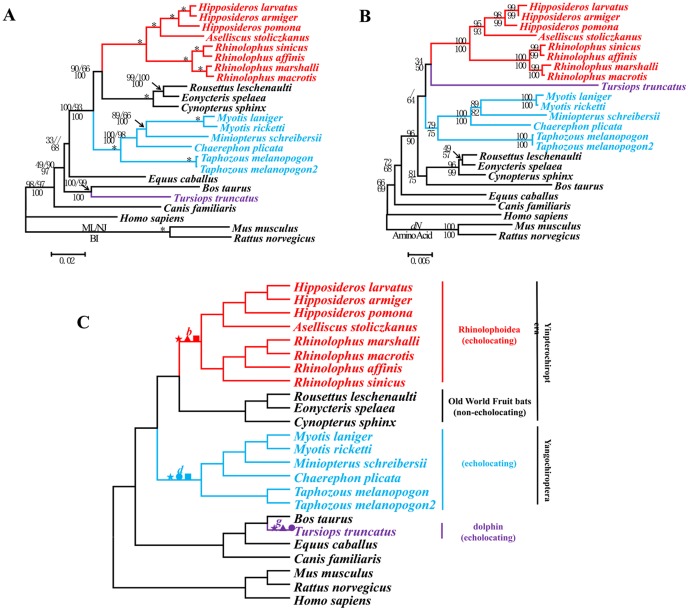
Figure 3. Parallel evolution of Otof in bats and dolphins.
(A) Gene tree of Otof based on nucleotide sequences. Numbers above the branches are the ML and NJ bootstrap values, respectively. Numbers below the branches are Bayesian posterior probabilities. * indicates all values equal 100. (B) Gene tree of Otof based on the nonsynonymous changes and corresponding amino acid sequences. Numbers on the branches are NJ bootstrap values. (C) Species tree based on the previous studies [26]–[28]. Symbols above the branches correspond to amino acid replacements. ★ indicates a parallel amino acid replacement presenting on branches b, d, and g: D396E. ▴ indicates parallel amino acid replacements presenting on branches b and g: P191H, G213A, D396E, and V440M. • indicates parallel amino acid replacements presenting on branches d and g: D396E and R1238H. ▪ indicates a parallel amino acid replacement presenting on branches b and d: D396E.

