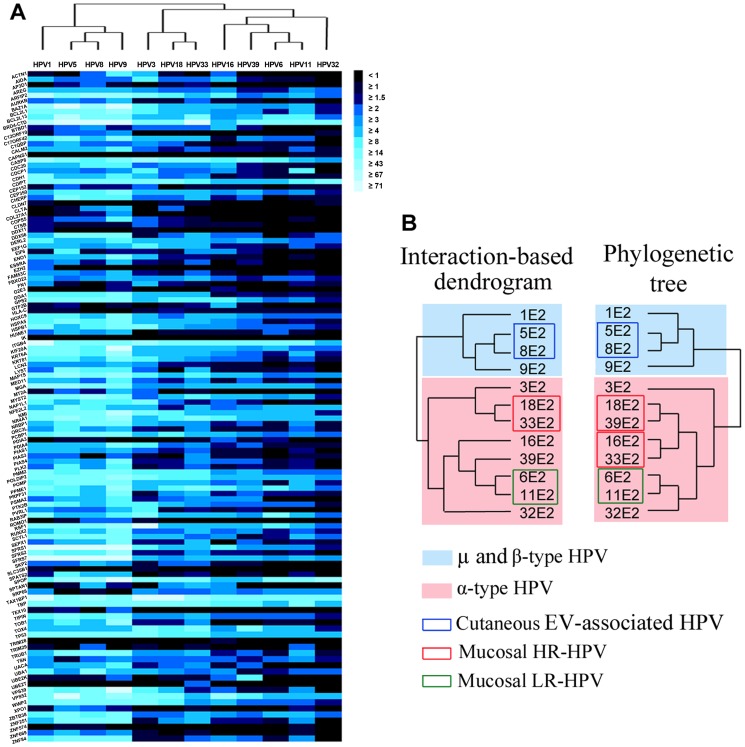
Figure 3. Interaction map between the 12 E2 proteins and the 121 cellular proteins by HT-GPCA and hierarchical clustering.
(A) Heat maps representing the complete dataset of interactions between the 12 E2 proteins (by columns) and the 121 cellular proteins (by rows). The intensity of interaction is represented by the colour, from black (no interaction) to light blue (strong interactions) based on Normalized Luminescence Ratio (NLR). The E2-PPI profiles were clustered according to their similarities by hierarchical clustering (tree above the heat map). (B) Interaction dendrogram generated from the hierarchical clustering of E2-interaction profiles and phylogenetic tree based on E2 sequences alignment.

