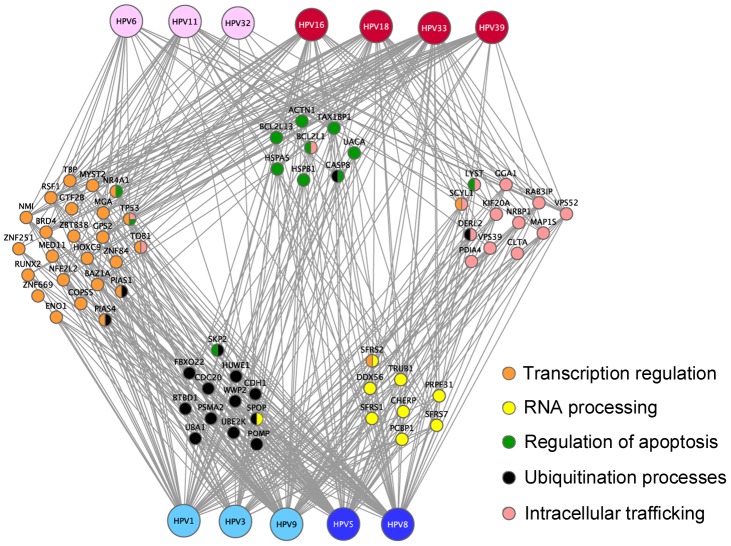
Figure 5. E2-targeted functional families.
Cellular proteins (nodes) classified into enriched families based on the Gene Ontology annotations are colored according to the associated GO functions. Proteins shared by different families are bi-coloured. The network representation was generated by Cytoscape.

