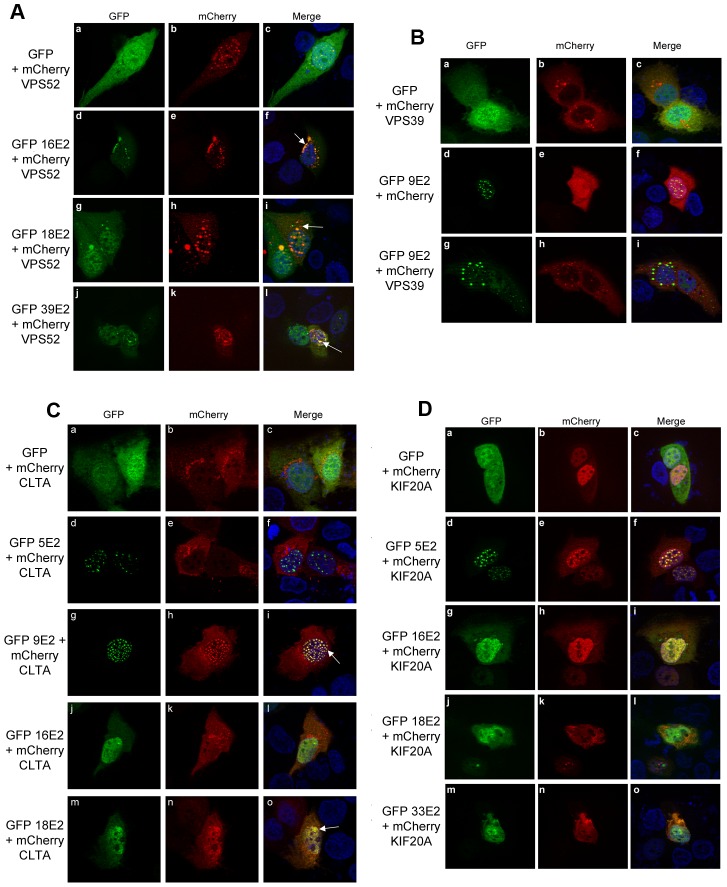
Figure 7. Fluorescence analysis of interactions between E2 proteins and intracellular transport proteins.
(A–D) HaCaT cells were cotransfected with expression plasmids for the indicated GFP-E2 proteins and mCherry-VPS52 (A), mCherry-VPS39 (B), mCherry-CLTA (C), and mCherry-KIF20A(D). After fixation, the cells were subjected to fluorescence microscopy after counterstaining of the nucleus with DAPI.

