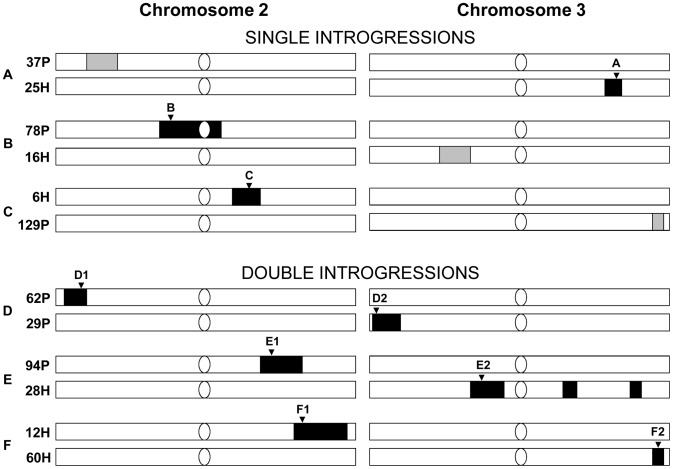
Figure 1. The introgression lines for establishing initial generation of six cross sets for competition experiments.
The light bars represent simulans chromosome II or III, and the dark blocks represent sechellia introgression regions. Confirmed introgressions are shown in black. Unconfirmed introgressions are shown in grey. Microsatellite markers tracked in the experiment are labeled by the inverted triangles: A: DMU25686 (cytological position: 93F14); B: DRODORSAL (36C8); C: DROGPAD (47A9); D1: AC005732 (cytological position 24C9); D2: DMRHO (62A2); E1: DMMP20 (49F13); E2: DMCATHPO (75E1); F1: DS00361 (54B5); F2: DMU43090 (99D5) [53], [54] (see Materials and Methods for details of each marker and for single versus double introgression designs).

