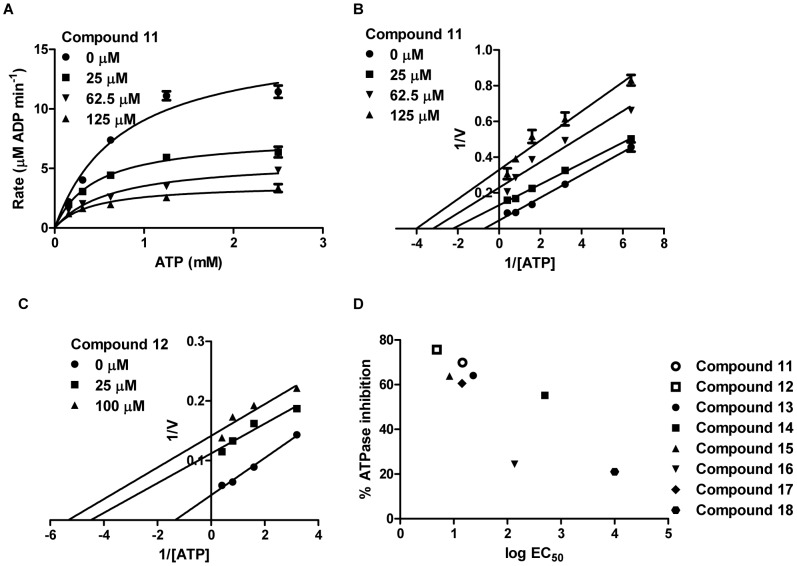
Figure 5. Enzyme kinetic analyses of LuxO ATPase inhibition.
(A) Michaelis-Menton enzyme kinetic analysis of LuxO ATPase activity. The LuxO D47E ATP hydrolysis rate is plotted as a function of the concentration of ATP in the presence of the indicated amounts of compound 11. Error bars represent standard errors of the mean for at least three independent trials. (B) Lineweaver-Burk plot derived from the assay described in (A). (C) Lineweaver-Burk plot derived from a LuxO D47E ATPase assay in the presence of the indicated amounts of compound 12. (D) Correlation between % inhibition of LuxO D47E ATPase activity (2.5 mM ATP and 30 µM inhibitors) and EC50 of QS-activation potency (derived from Figure 3) for the different LuxO inhibitors.

