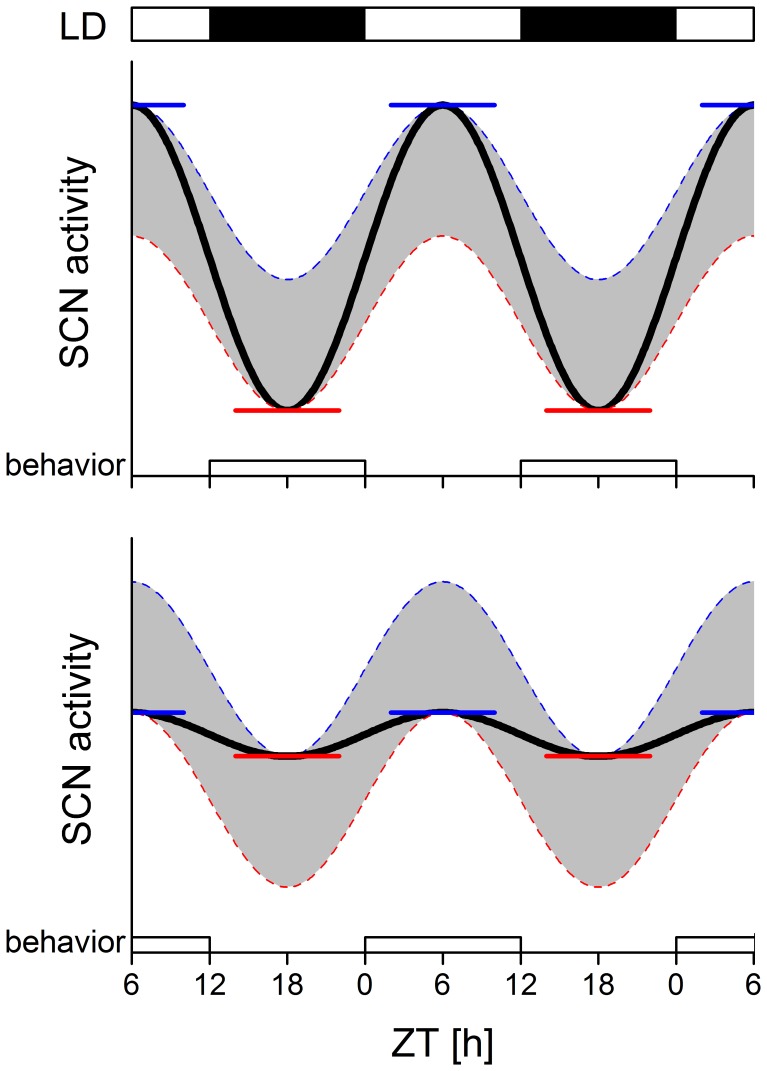
Figure 7. Consequence of night- versus day-time activity on SCN rhythm amplitude.
Blue line represents the SCN activity in the absence of behavioral activity; red line represents the SCN activity in the presence of behavioral activity. Both lines are based on results shown in Figure 6. The black lines represent two extreme possibilities: (a) when behavioral activity is concentrated during the night and is absent during the day, the amplitude of the SCN electrical activity is maximal. (b) In contrast, when behavioral activity would occur during the day and rest occurs during the night, the SCN amplitude will be negatively affected and shows a reduced amplitude. Horizontal lines indicate peak and trough SCN activity levels. The LD12∶12 light cycle is indicated above the record (white, lights on; black, lights off).

