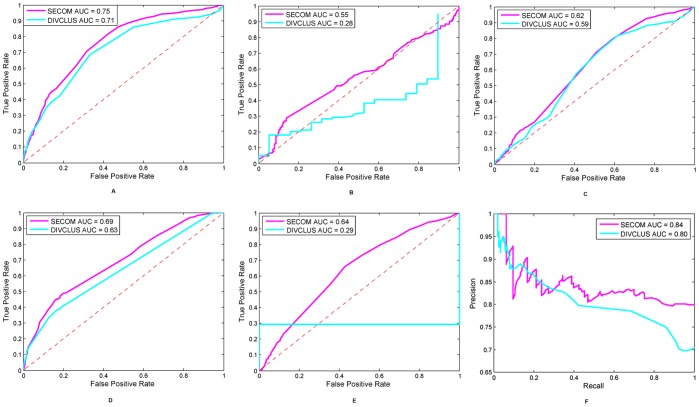
Figure 4. Performance with varying thresholds.
(A)–(E). ROC curves for SECOM (magenta) and DIVCLUS (cyan) on sponge, coral, hydra, urchin and sea anemone, respectively. (F). Precision-recall curves for SECOM (magenta) and DIVCLUS (cyan) on sponge. The ROC plots suggest that SECOM provides a better overall performance. At small false positive rate, SECOM has very similar but slightly lower AUC, i.e., AUC for FPR below 5% is 0.0056 v.s. 0.0064, 0.0022 v.s. 0.0025, 0.0016 v.s. 0.0020, 0.0062 v.s. 0.0062, and 0.0017 v.s. 0.0150 on sponge, coral, hydra, urchin and sea anemone, respectively.

