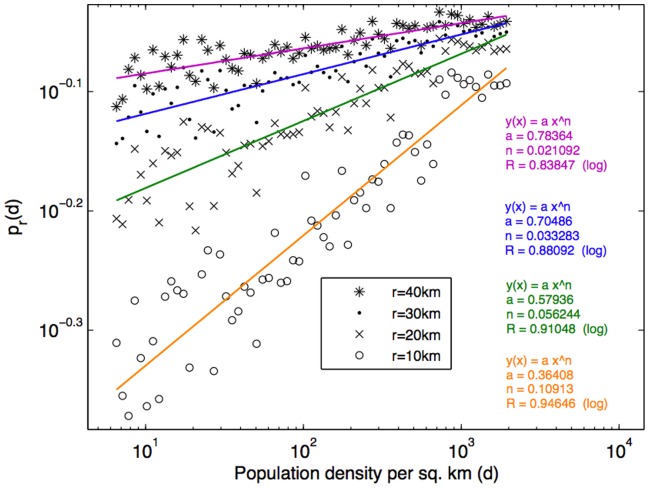
Figure 9. The likelihood of being within r km from a social tie  increases with the municipality population density (d), and this relationship can be fitted with the power law.
At the same level of population density, the likelihood  is lower for a smaller value of r (as shown with sample values of r from 10km to 40km). Meanwhile with a smaller value of r, the likelihood increases with the population density level at a higher rate.

