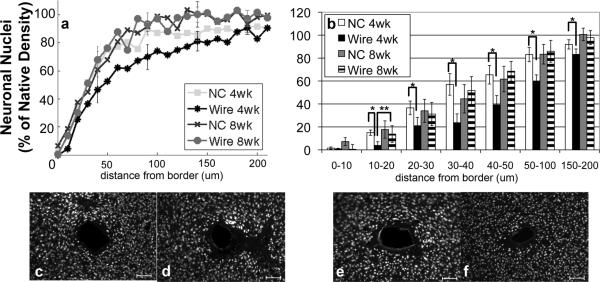
Figure 3.
Analysis of NeuN Immunohistochemistry. a) Quantification of NeuN based on distance from the tissue-implant border in response to implants: four week NC (square), four week wire (asterisk), eight week NC (cross), eight week wire (circle). Points represent histogram counts in 10 μm intervals. Counts have been scaled based on area as well as background count per image. b) Average count of NeuN as a function of distance from the tissue-implant border ± standard error. Four week NC (white), four week wire (black), eight week NC (gray), eight week wire (striped) *= p<0.05 for intraweek comparisons, **<0.05 for interweek comparisons.

