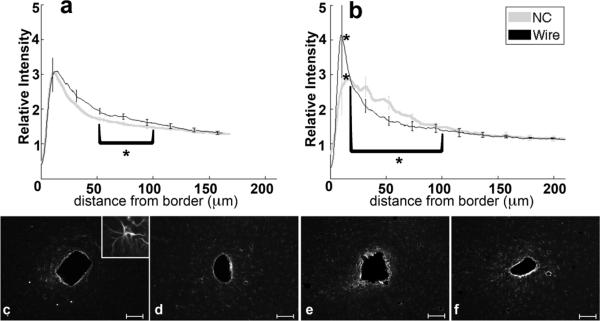
Figure 4.
Analysis of GFAP-Reactive Astrocytes as a function of distance from the tissue-implant border. a) Relative intensity ± standard error as a function of distance from border of four week NC (gray) and wire (black). Brackets indicate an integral of intensity. b) Relative intensity ± standard error as a function of distance from border of eight week NC (gray) and wire (black). Representative images of GFAP for c) four week NC, inset 50μm wide close-up of reactive astrocyte, d) four week wire, e) eight week NC, and f) eight week wire. Scale bars 100 μm. *=p<0.05.

