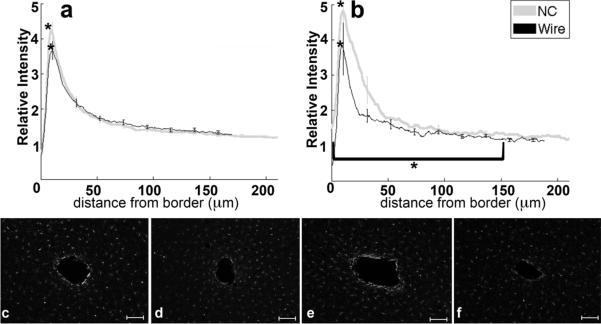
Figure 7.
Analysis of IBA1-Microglia immunohistochemistry as a function of distance from the tissue-implant border. a) Relative intensity ± standard error as a function of distance from border of four week NC (gray) and wire (black). Brackets indicate an integral of intensity. b) Relative intensity ± standard error as a function of distance from border of eight week NC (gray) and wire (black). Representative images of IBA1 for c) four week NC, d) four week wire, e) eight week NC, and f) eight week wire. Scale bars 100 μm. *= p<0.05.

