
Figure 4.
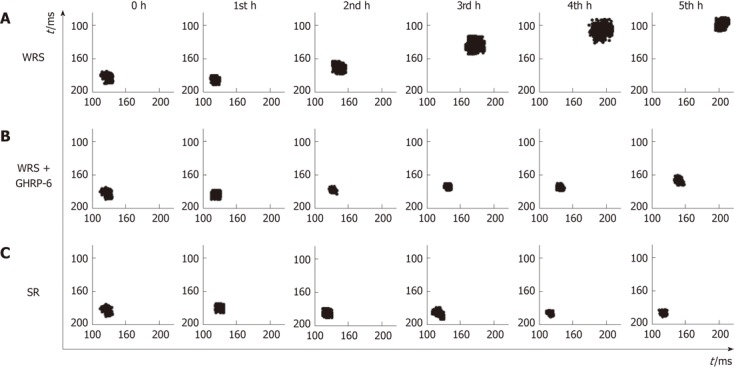
Pointcaré plots of the R-R intervals in different groups. A: The plots indicate that heart rate decreased gradually with time, and heart rate variability (HRV) was increased as shown by the scattered pattern of the plots in the water immersion restraint stress (WRS) group, suggesting vagal overactivity in this group; B: Changes of the heart rate and HRV in the WRS + growth hormone releasing peptide-6 (GHRP-6) group were much less than the WRS group; C: In the simple restraint (SR) group, the heart rate increased and the HRV was decreased as shown by the condensed geometry of the plots, suggesting increased sympathetic activity in this group.