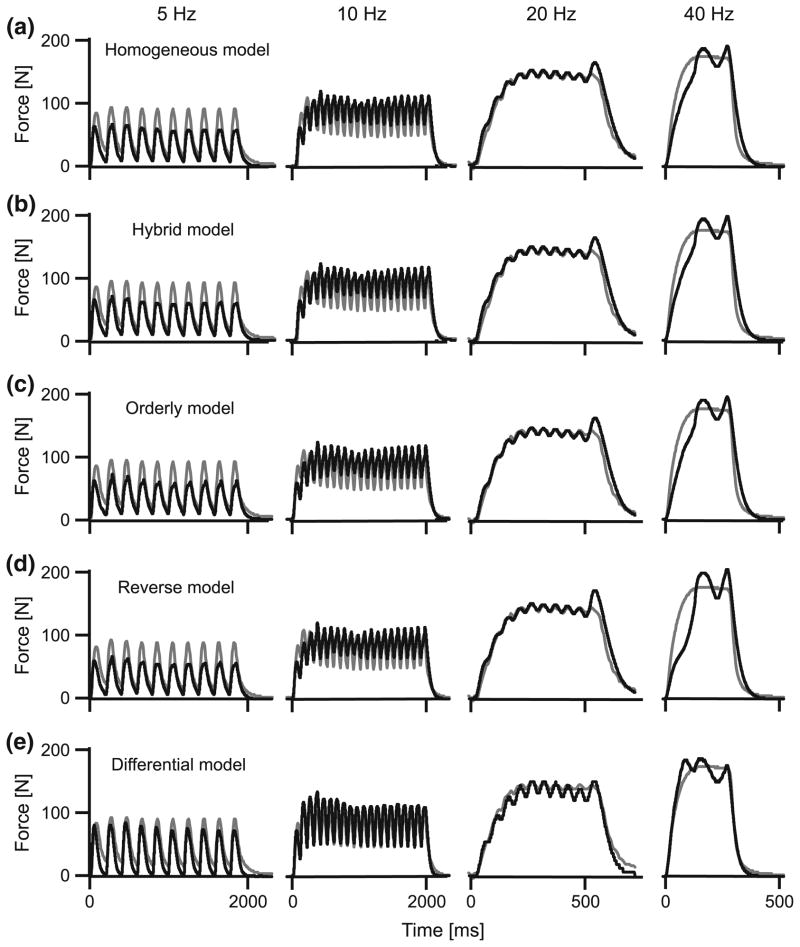
FIGURE 3.
The performance of the different muscle models across a range of stimulation frequencies for the lateral gastrocnemius. Measured tendon forces are shown in gray, and predicted forces are shown in black. The forces were modeled with v0 estimated at 5 and 10 s−1 for the slow and fast-fibers, respectively, and with fast fibers comprising 75% of the muscle.

