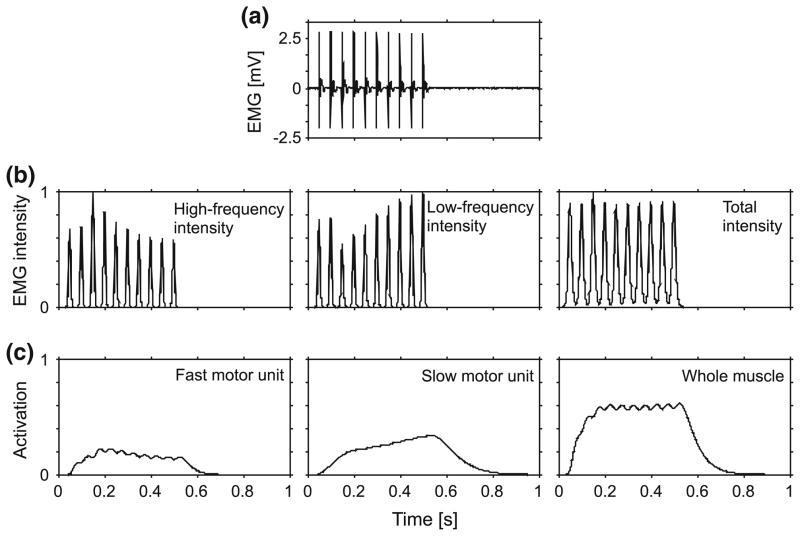
FIGURE 6.
EMG and activation states for the medial gastrocnemius during a tetanic contraction stimulated at 20 Hz. Raw EMG is shown in panel a. EMG intensity is shown for the high (240.5–422.9 Hz) and low (82.4–247.0 Hz) frequency bands (b), corresponding to the fast- and slow-motor unit activity, respectively. The intensities were normalized to their maximum values during these supramaximal stimuli. The activation profiles are shown for the fast- and slow-motor units, and a general activation for the whole muscle (c).

