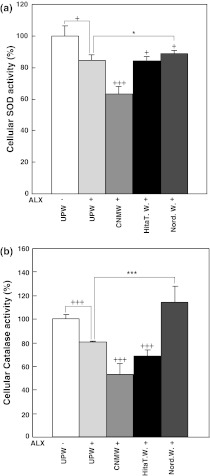
Fig. 2.
Effect of NRWs on cellular SOD and catalase production in alloxan-treated HIT-T15 cells. HIT-T15 cells were pretreated with various waters for 24 h prior to 4 h treatment with 1 mM alloxan. Cells were harvested and processed for SOD activity (a) and catalase activity (b) as described in the “Materials and methods” section. Values represent the means ± standard error of the mean of three independent experiments. +p < 0.05, +++p < 0.001, UPW(−) compared with various waters with alloxan treatment; *p < 0.05, ***p < 0.001, UPW(+)ALX compared with Hita T. W.(+)ALX or Nord. W.(+)ALX. Group designations are the same as those in Fig. 1a

