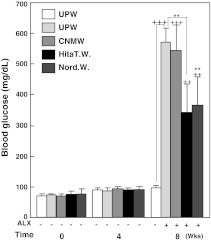
Fig. 5.
The effect of various waters on blood glucose levels of normal and diabetic CD-1 mice induced by alloxan. CD-1 mice were treated as described in the study protocol (Fig. 3). Each value denotes the mean ± standard error of the mean (n = 8). ++p < 0.01,+++p < 0.001, control (ultrapure water without alloxan) compared with various waters with alloxan. **p < 0.01, ultrapure water with alloxan compared with various waters with alloxan. Group designations are the same as those in Fig. 1a

