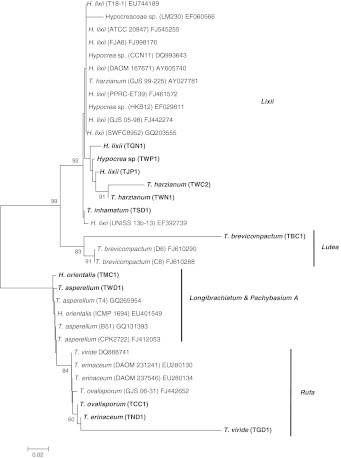
Fig. 1.
Phylogram based on the ITS region of the genomic rRNA gene of 12 isolates and 22 representative strains of Trichoderma with isolate number indicated in parenthesis. The phylogram was generated after DNA distance based and neighbor-joining analysis of the data. Bootstrap 50% majority-rule consensus tree (1,000 replications), indicated above the nodes, was generated using MEGA 3.1

