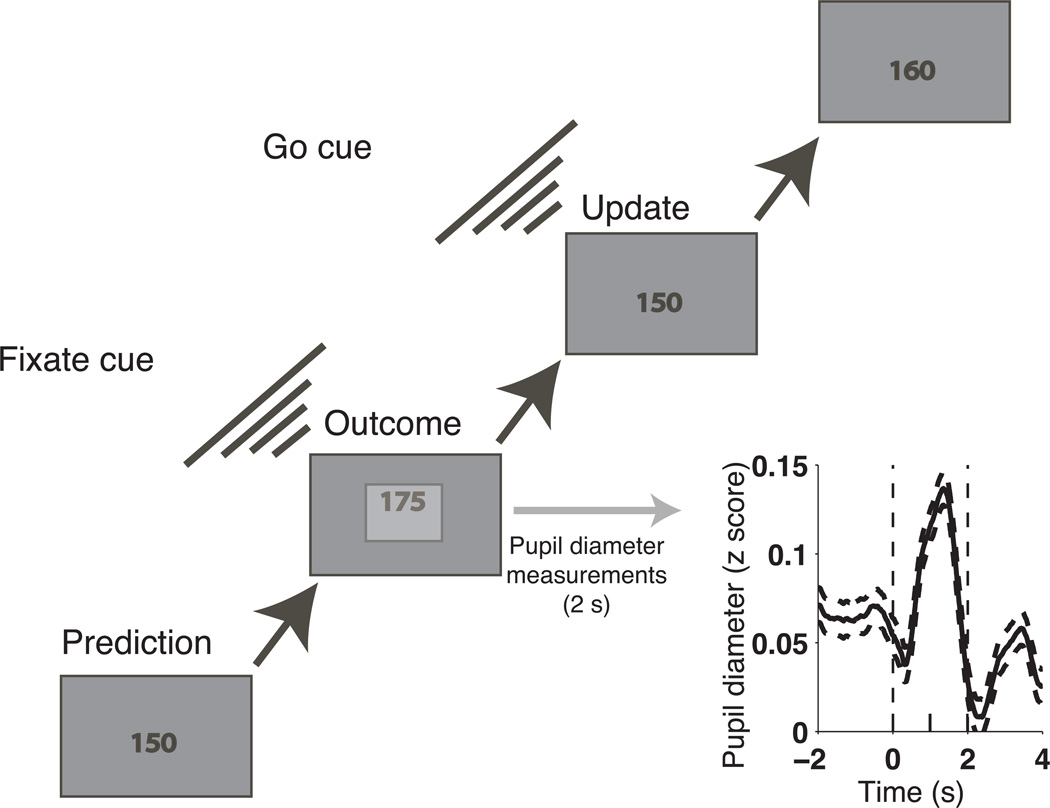
Figure 1.
Predictive–inference task sequence and pupillometry. Learning rate was computed by dividing the difference in the prediction from one trial to the next by the difference between the current outcome and the current prediction. Inset: mean±SEM pupil diameter, averaged across z–scores computed per subject, aligned to outcome presentation (time=0). Pupil average was computed for each trial as the mean pupil diameter, z–scored by subject, across the entire 2–s fixation window (vertical dashed lines). Pupil change was computed for each trial as the difference in mean diameter, z–scored by subject, measured late (time=1–2s) versus early (time=0–1s) during fixation.

