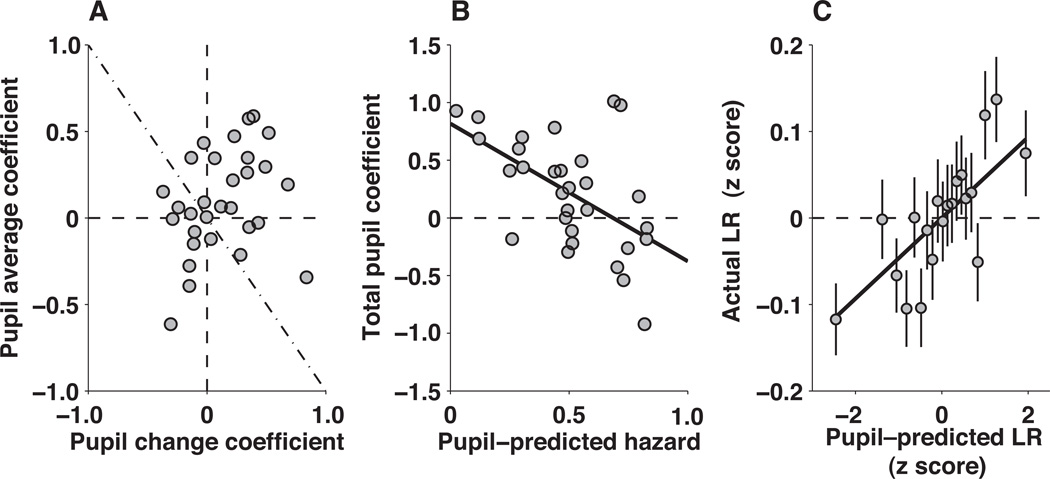
Figure 7.
Pupil metrics predict learning rate. A, Regression coefficients describing the linear, trial–by–trial relationships between pupil change and the subsequent learning rate (ordinate) and between pupil average and the subsequent learning rate (abscissa). Points are regression coefficients computed for each subject individually, using a four–parameter regression model that also included trial number and block number as covariates. B, The relationship between learning rate and pupil parameters depended on the subject’s baseline pupil response. For each subject, the sum of the regression coefficients from panel A are plotted as a function of the pupil–predicted hazard rate from Figure 6C. The line is a linear fit (r= −0.059, p<0.001). C, Predicted versus actual learning rate. Both values are z–scored per subject. Data from all subjects are grouped into 20 equally sized bins of predicted learning rate. The line is a linear fit to the unbinned data (Slope = 0.052 zActual/zPredicted, p<0.001 for H0: slope=0).

