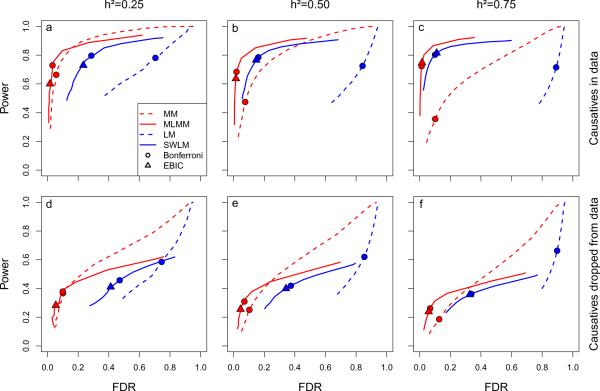
Figure 2.
Power and false discovery rate (FDR) in the 100-locus model simulations for four different mapping methods: linear model (LM), stepwise linear model (SWLM), mixed-model (MM), and multi-locus mixed-model (MLMM). For the purpose of computing power and FDR, a causal SNP was considered detected if a SNP within 25kb on either side was declared significant (results for other window sizes are given in Supplementary Fig. 3), and only causal SNPs that were in principle detectable (i.e., that were marginally significant at a Bonferroni-corrected threshold of 0.05 in a simple linear model were considered. For clarity, only the backward path of the multi-locus methods (SWLM and MLMM) is shown: a comparison between forward and backward paths is given in Supplementary Fig. 4. Circles and triangles denote the best-fitting model according to the Bonferroni and EBIC model-selection criteria, respectively. Three phenotypic heritabilities were used in the simulations: 0.25 (a, d), 0.50 (b, e), and 0.75 (c, f). Power and FDR was estimated with (a–c) and without (d–f) the causal loci included.

