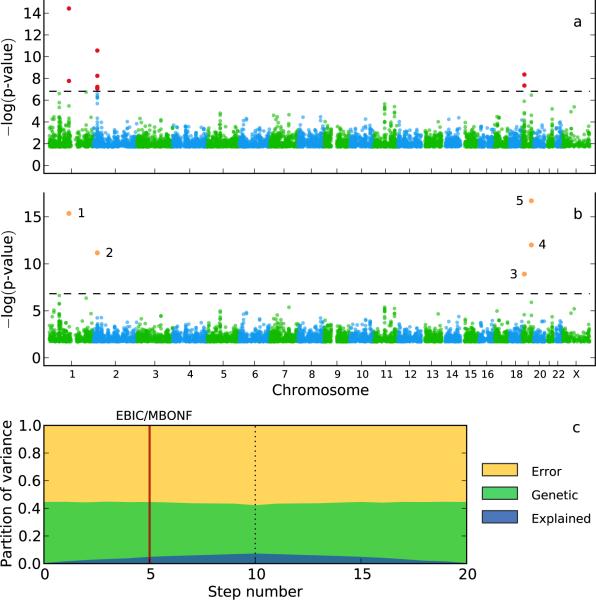
Figure 3.
GWAS for low-density lipoprotein (LDL) in the NFBC1966 dataset. (a) A single-locus mixedmodel identifies seven SNPs in three genes (marked in red; Bonferroni-corrected threshold of 0.05; dashed horizontal line). (b) A multi-locus mixed-model (MLMM) identifies five SNPs in four genes (marked in orange, and numbered in the order they were included in the model). (c) Partition of variance at each step of MLMM (10 forward and 10 backward) into variance explained by: the SNPs included in the model (blue); kinship (green); and noise (yellow).

