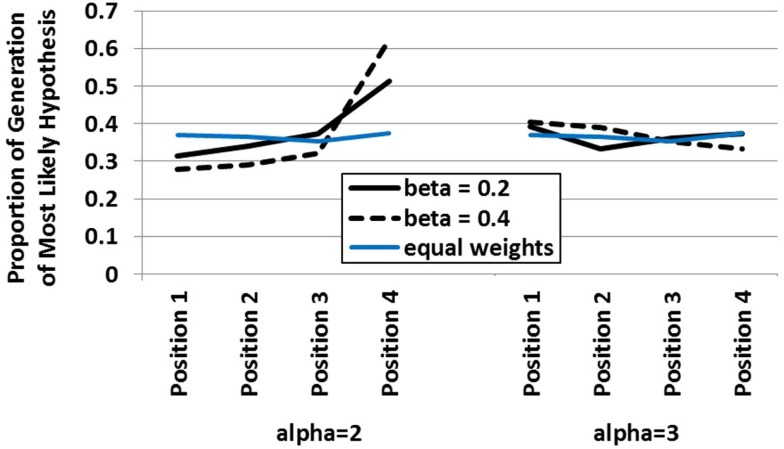
Figure 4.
Influence of data serial position on the hypothesis generation behavior of the dynamic HyGene model at two levels of alpha and beta (and the performance of an equal weighted model in blue). Data plotted represents the proportion of simulation runs on which the most likely hypothesis was generated.

