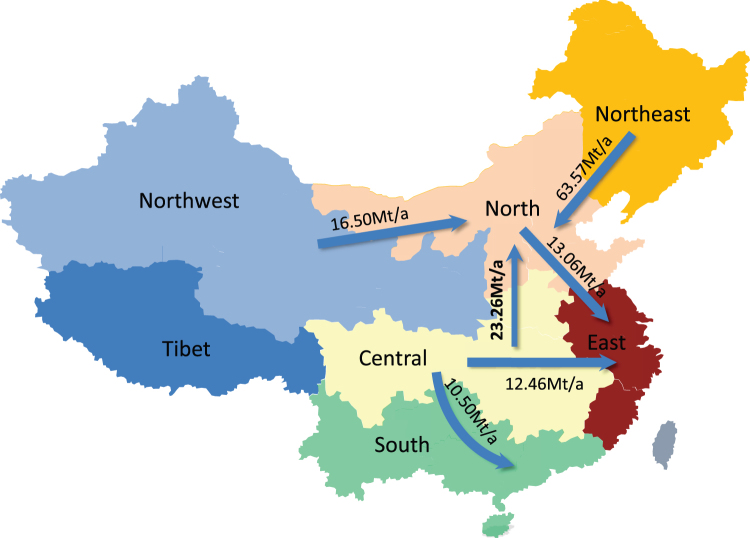
Figure 2. The carbon emission flow distribution and flow amount (AB) of China in 2010.
According to the transmission corridors and power supply and demand among these area power systems, there are six main carbon flows in the national area, and most of the carbon flow accumulates in the northern and eastern areas. The carbon flow from the northeast to the north contains the largest amount because most of the power flow through this corridor is generated by thermal units.

